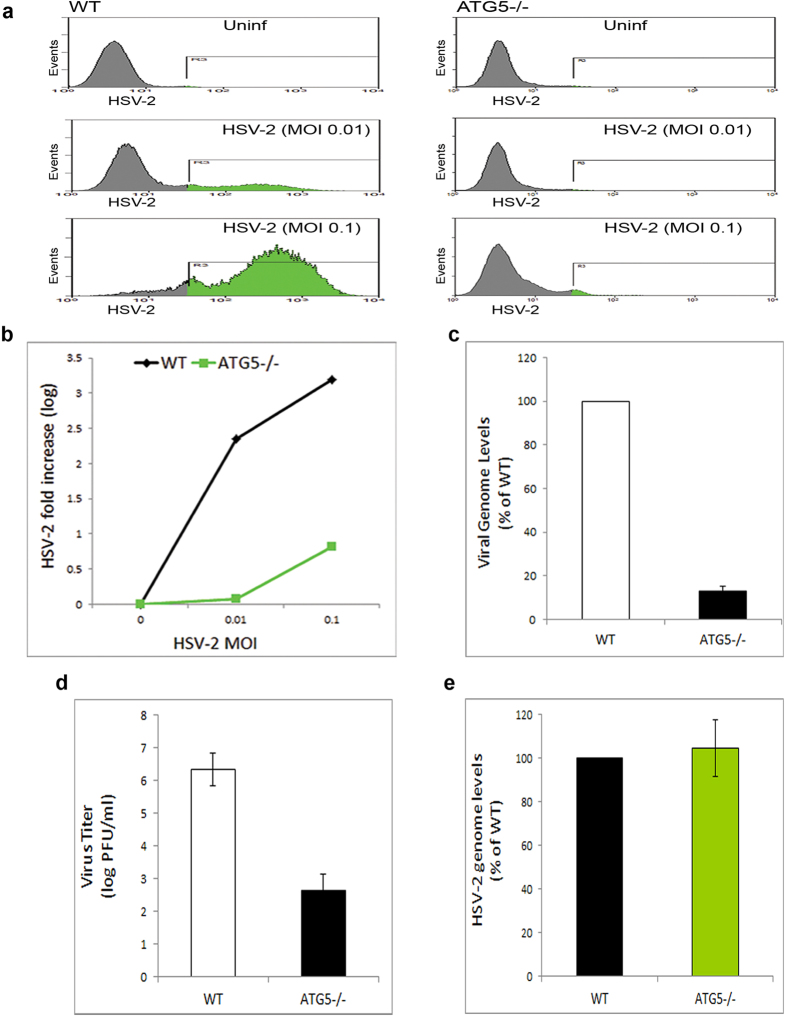
Figure 5. Autophagy-deficient cells are resistant to HSV-2 infection.
(a) WT or ATG5−/− MEFs were uninfected or infected with HSV-2-GFP at the indicated MOIs, and viral yields were determined by FACS analysis at 24 hpi. (b) Quantification of viral levels in (a), based on the integrated MFI (=percentage X MFI) of the GFP-positive population in the gated region R3. The graph shows relative fluorescence levels of infected cells to background of uninfected cells. (c) Viral DNA was isolated from HSV-2-infected WT or ATG5−/− MEFs at 14 hpi, and quantified using qPCR. (d) WT or ATG5−/− MEFs were infected with HSV-2. After 24 hr, the supernatants of infected cells were collected and titered using plaque assay. (e) WT or ATG5−/− MEFs were infected with HSV-2 for 2 hrs, followed by determination of internalized virus levels using qPCR assay for viral DNA.

