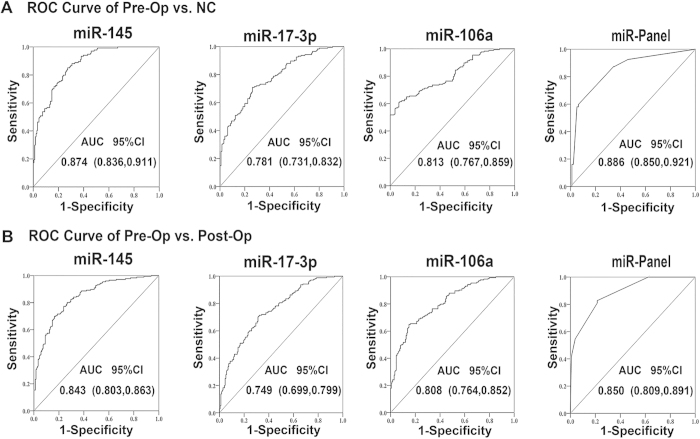
Figure 3. ROC curve analysis for the discrimination between pre-operative (pre-Op) and post-operative (post-Op) CRC serum samples and between CRC serum samples and control samples based on the three-serum miRNA profile.
(A) ROC curve for the ability of miR-145, miR-17-3p, miR-106a and the miR panel to separate the 175 pre-operative (pre-Op) from post-operative (post-Op) patients. (B) ROC curve for the ability of each miRNA and the miR panel to discern 175 CRC cases from 130 healthy controls (NC).

