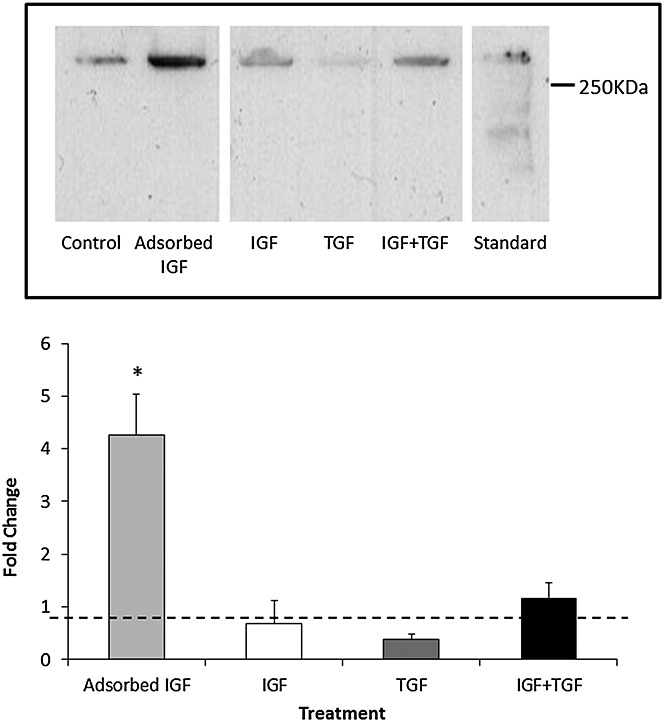
Figure 5.

Type II collagen deposition within the scaffold. (Top) Representative Western blot demonstrating the amount of type II collagen deposited by osteoarthritis chondrocytes within each scaffold group. Concentration of growth factors as in Table 1. Standard = extract of articular cartilage (Bottom) Type II collagen deposition in scaffolds quantified by densitometry of Western blot (top) expressed as fold change compared with the no-growth factor control group. N = 3 donors, N = 3 replicates. * represents a statistically significant difference between groups (p < 0.05) compared with control. IGF, insulin-like growth factor; TGF, transforming growth factor
