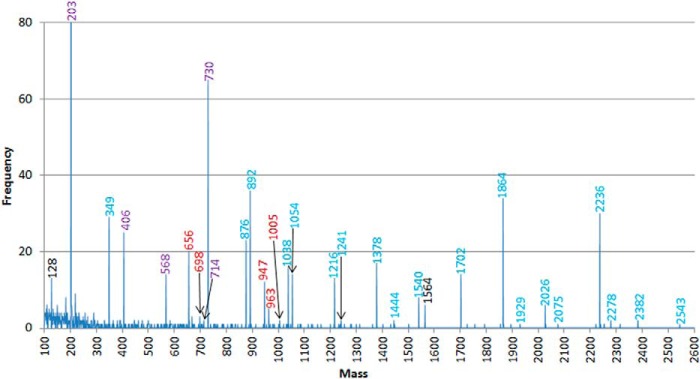
Fig. 1.

The histogram of mass modifications generated from liver glycopeptide ETD data permitting unspecified modifications on any Asn, Ser, or Thr residue of selected mouse proteins listed in the SwissProt database. Masses labeled in red correspond to O-linked glycan masses; those in blue correspond to N-linked glycan masses; those labeled in purple could be either N- or O-linked compositions. Masses in black do not correspond to glycan structures.
