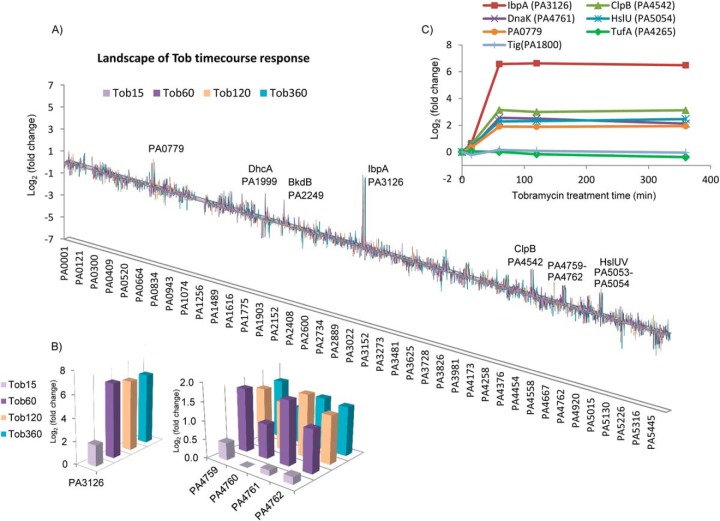
Fig. 2.
Time-dependent proteome response of P. aeruginosa to tobramycin. (A) Landscape of P. aeruginosa proteome response showing genes/operons that were most drastically changed in tobramycin time course treatment. X axis: P. aeruginosa gene locus. Y axis: log2 protein fold change of Tob15min/CK, Tob60min/CK, Tob120min/CK, and Tob360min/CK. Duration of tobramycin treatment is indicated with bar colors. PA0779, DhcA, BkdB, IbpA, ClpB, PA4759-PA4762, HslU-V were up-regulated, consistent with the results in the dosage treatment shown in Fig. 1C. (B) Inset of the proteome landscape showing time-dependent changes of IbpA and PA4759-PA4762. (C) Selected reaction monitoring (SRM) analysis for proteins that were dramatically increased in the tobramycin time course treatment. The SRM protein abundance ratio is shown, which represents the average of the peptide ratios from the protein. Interestingly, rapid increase of heat shock proteins and proteases occurred from 15 min to 60 min after tobramycin treatment, and the abundance level sustained till 360 min (last time point measured).

