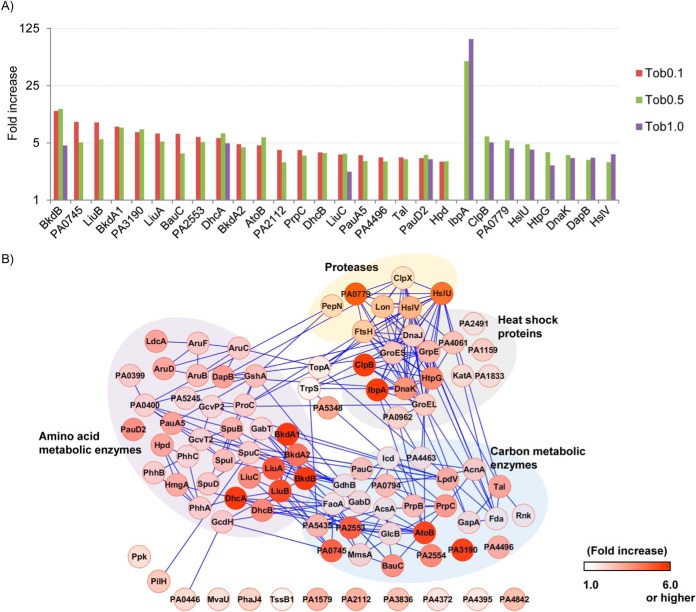
Fig. 5.
Dosage-dependent induction of proteome subsets and quantitative proteome interaction network. (A) The top 30 proteins with greatest fold changes from the three tobramycin dosage treatments were compared. The emPAI fold changes of those common in at least two dosages were plotted. Interestingly, very few proteins were common to be the top 30 in all three dosages, and the proteins that were common in two dosages were more likely to be shared between 0.1 and 0.5 μg/ml or 0.5 and 1.0 μg/ml. (B) Quantitative proteome interaction network for proteins significantly increased (P ≤ 0.05) in 0.5 μg/ml tobramycin treatment. The network was visualized with Cytoscape (version 2.8) (47). Each node indicates the protein identity, and the extent of increase is shown in red. The protein fold change from spectral counting was used. The edges indicate the protein co-regulation evidence of the connected nodes referenced from STRING database (33). Four functional clusters are observed in the network.

