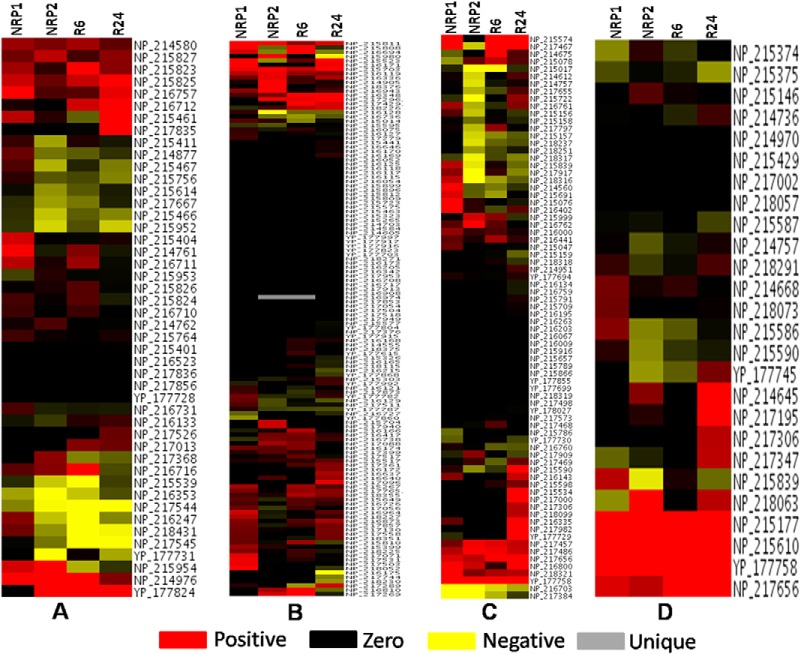
Fig. 5.
Heat maps of proteins present in – A, TCA, glycolysis, glyoxylate, and electron transport chain, B, Amino acid metabolism, C, Lipid biosynthesis, and D, Lipid degradation. Positive values indicate up-regulated proteins, negative values represent down-regulated proteins and zero values represent proteins that are absent in a particular stage, but present in the control.

