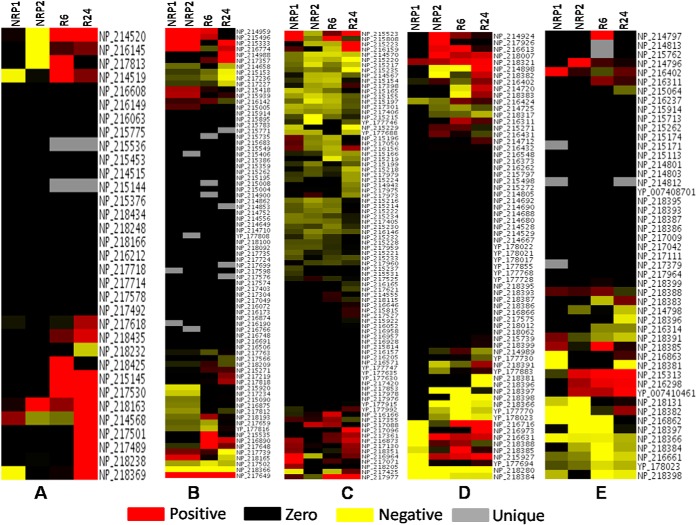
Fig. 6.
Heat map of proteins present in – A, DNA replication and repair, B, Transcription, C, Protein synthesis, D, Toxin-antitoxin system, and E, Virulence factors. Positive values indicate up-regulated proteins, negative values represent down-regulated proteins and zero values are proteins that represent absent in a particular stage, but present in the control.

