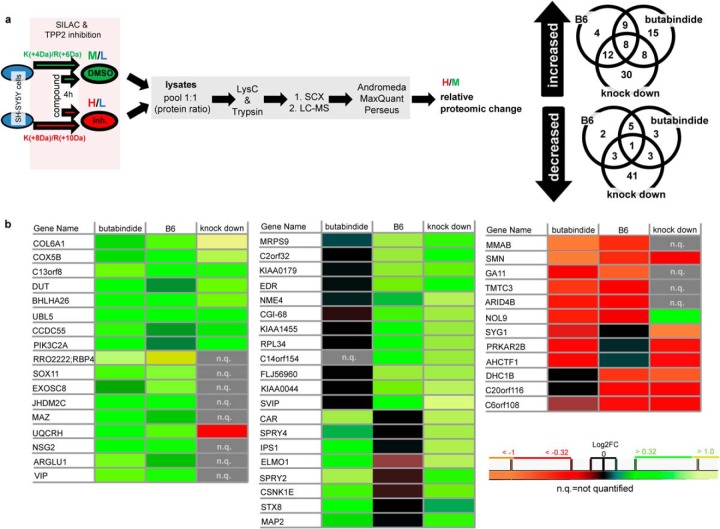
Fig. 3.
SILAC approach and resulting proteins affected by TPP2 inhibition and/or knock down. (A) Schematic presentation of experimental setup to determine relative proteomic changes. Venn diagrams represents proteins reproducible quantified (P1 and significance B(Log2FC versus Intensity); p < .05) that are minimum 1.25-fold (inhibitors) or 1.5-fold (knock down) increased (upper Venn diagram) or decreased (lower Venn diagram). For details of quantification see online Supplemental Table I for the overlapping proteins and online Supplemental Table II for the proteins significantly changed by only one condition. (B) Heat maps of median Log2FC of B6, butabindide and TPP2 knock down representing targets (first gene name of MaxQuant hit list) showing the same change in minimum two out of three conditions (quantification details and protein names see Supplemental Table I).

