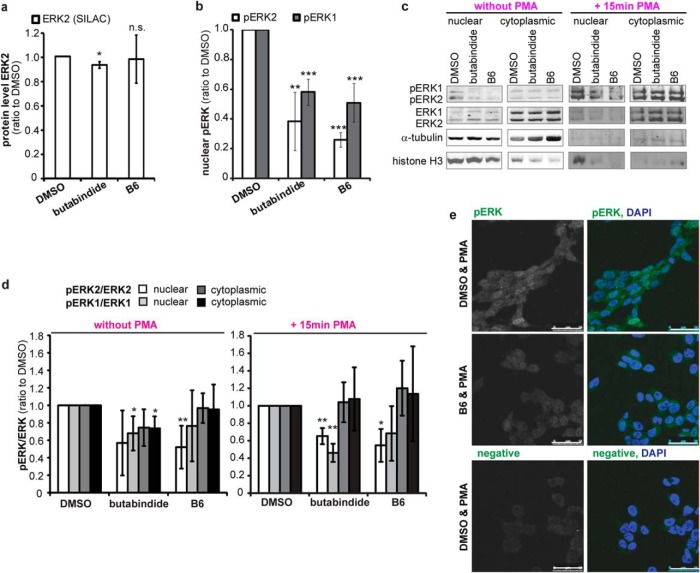
Fig. 6.
(A) TPP2 inhibition does not affect ERK2 cellular protein level. Median relative ERK2 protein level normalized to DMSO treated cells as determined by SILAC (n = 4 biological replicates, ±S.D. (butabindide n = 3, B6 n = 4 quantified replicates). (B) TPP2 inhibition decreases levels of nuclear, active phosphorylated ERK1 and ERK2. Bar diagram: Mean nuclear di-phosphorylated ERK2 (T185 & Y187, pERK2) and ERK1 (T202 and Y204, pERK1) protein level normalized to histone H3 loading control relative to DMSO control treated cells as determined by quantification of Western blot signals (n = 4, ±S.D., all Western blots are presented in Supplemental Fig. 5, one representative Western blot is shown in the right panel Fig. 6C). (C)–(E) TPP2 inhibition decreases phosphorylation level (active form) of nuclear ERK1 and ERK2 even when stimulating their phosphorylation with phorbol-12-myristate 13-acetate (PMA). (C) Representative Western blots of nuclear-cytoplasmic (cytopl.)-fractionation from DMSO and TPP2-inhibitor-treated cells without (left panel) and with 15min PMA treatment that were stained for pERK2 and pERK1, ERK2 and ERK1, and the loading controls α-tubulin and histone H3. (D) Mean phosphorylation level of ERK1 and ERK2 in nucleus and cytoplasm. Di-phosphorylated ERK2 (T185 & Y187, pERK2) to total ERK2 and di-phosphorylated ERK1 (T202 and Y204, pERK1) to total ERK1 protein level relative to DMSO-control-treated cells as determined by quantification of Western blot signals (n = 4 biological replicates, ±S.D., Western blots used for quantification are shown in Fig. 6C and Supplemental Figs. 5C and 5D). (E) Representative confocal images of PMA-treated cells inhibited with B6 or treated with DMSO as control that were immunostained for pERK1 and pERK2 (one antibody recognizing both, first column gray, second column (overlay) green) and DAPI (blue in overlay second column). White bar represents 50 μm.

