Fig. 7.

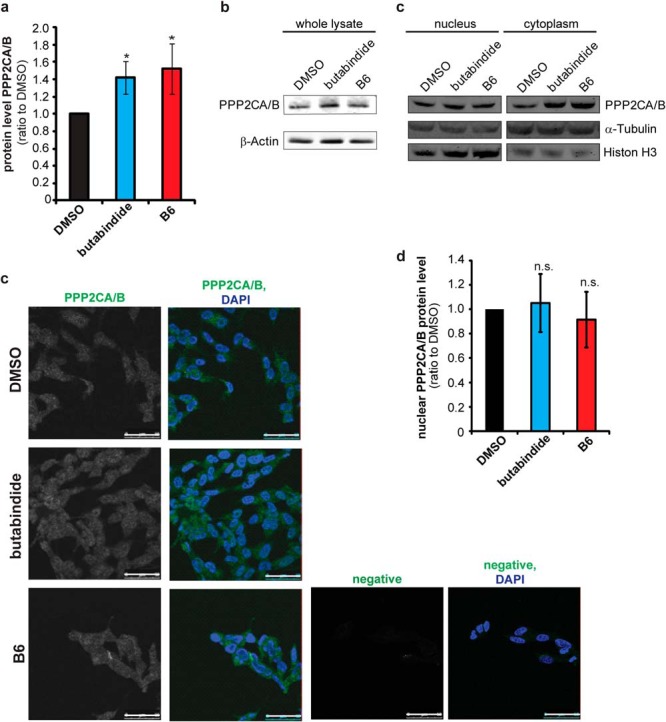
(A) and (B) TPP2 inhibition increases total cellular protein phosphatase 2A (PP2A) level. Bar diagram shows mean quantification results of Western blots of cell lysates stained for PPP2CA/B, the PP2A 36 kDa catalytic subunits, normalized to β-actin relative to DMSO-control-treated cells. (lysis: PBS/digitonin; n = 5 biological replicates ±S.D., one representative blot is shown in 7B, the other four in Supplemental Fig. 6A; significance: * .05≥p ≥ .01) (B) Representative Western blot used for quantification of total cellular PPP2CA/B level. (C)–(E) No change in nuclear phosphatase 2A (PP2A) level. (C) Representative Western blot of nuclear-cytoplasmic (cytopl.)-fractionation stained PPP2CA/B catalytic subunits and the loading controls α-tubulin and histone H3. (Additional Western blots of three further replicates and quantification results are presented in Supplemental Figs. 6B-D) Western blots including quantification is shown in Supplemental Fig. 6) (D) Representative confocal images of cells inhibited with B6 or treated with DMSO as control that were immunostained for PPP2CA/B, the catalytic subunit of PP2A (first column gray, second column (overlay) green) and DAPI (blue in overlay second column). Negative immunostain is of cells (second antibody only) is shown in gray in the third column and in green in the overlay with DAPI (fourth column). White bar represents 50 μm. All pictures have been taken with the same confocal settings (laser power, gain, offset, and for presentation purposes have been processed with Adobe Photoshop with the same settings (contrast, brightness). (E) Graph: mean nuclear PPP2CA/B protein level as determined by confocal microscopy (n = 3 biological replicates ±S.D., n = 200 cells/condition, images/experiment n = 3–8). Mean gray value of the whole nuclear area (as marked by DAPI) was determined after subtracting the background (negative immunostain nuclear mean gray value) and normalizing to DMSO nuclear PPP2CA/B signal. All images used for one experiment were taken with the same confocal settings (laser power, gain, offset). An exemplary quantification is presented in Supplemental Fig. 6D).
