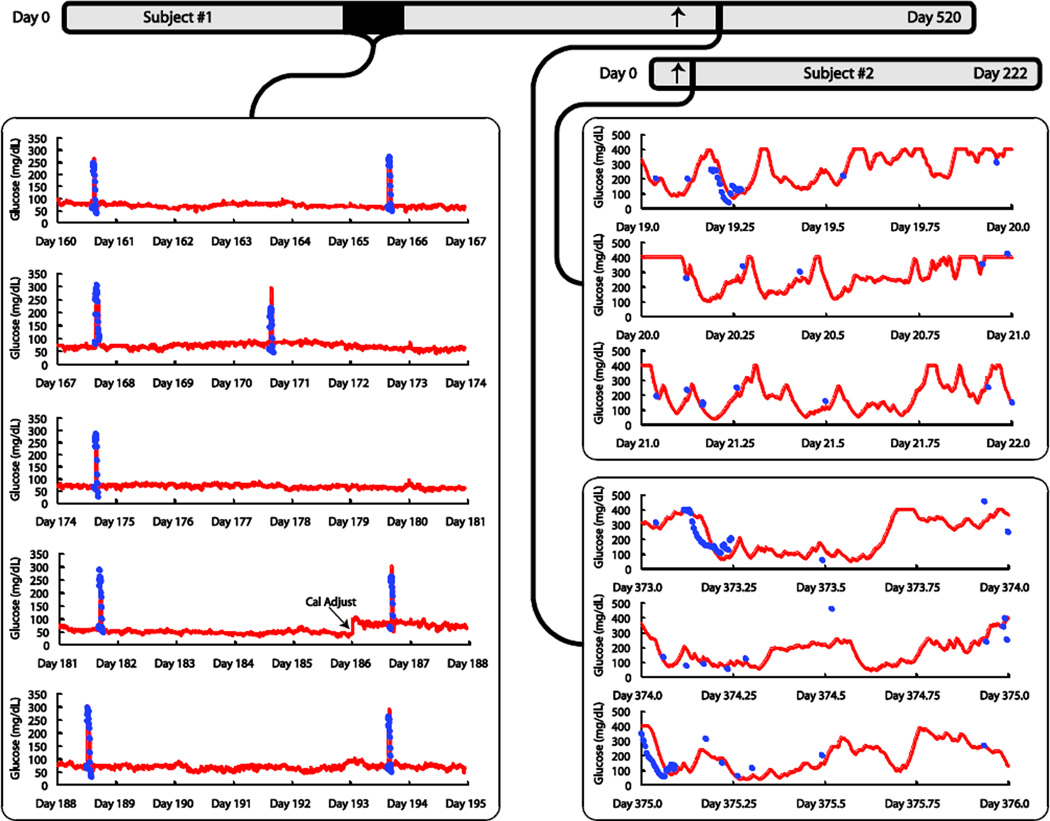
Figure 2. Long-term continuous monitoring in non-diabetic (left panel) and diabetic pigs (right panel).
Timelines for sensor operation in Subjects #1 and #2 are provided at the top; diabetes induction is indicated for each animal by an arrow. Sensor outputs are shown as solid red lines, and plasma glucose values from laboratory analysis (YSI) of central venous samples are shown as solid blue circles. Left Panel: The displayed five-week period begins 23 weeks after implantation in Subject #1. Plasma glucose values were sampled during intravascular glucose tolerance tests (IVGTTs) administered once or twice weekly to assess the sensitivity to glucose during the nondiabetic phase. One system calibration adjustment was performed during the entire period (on day 186). Glucose levels are relatively stable between IVGTTs in non-diabetic pigs in spite of eating, and intravenous glucose challenges were required to produce significant glucose excursions. Right Panel: The sensor output is shown over two continuous three-day periods in two diabetic pigs. In Subject #1, the sensor had been operated for 352 days with the animal in the non-diabetic state at the time of induction of diabetes, after which monitoring continued for 168 more days. The segment displayed begins on day 373 after sensor implantation (21 days after conversion of the animal to diabetic). In Subject #2, diabetes was induced 16 days after device implantation, after which monitoring continued for another 206 days. The segment displayed begins on day 19 after sensor implantation (3 days after conversion of the animal to diabetic).

