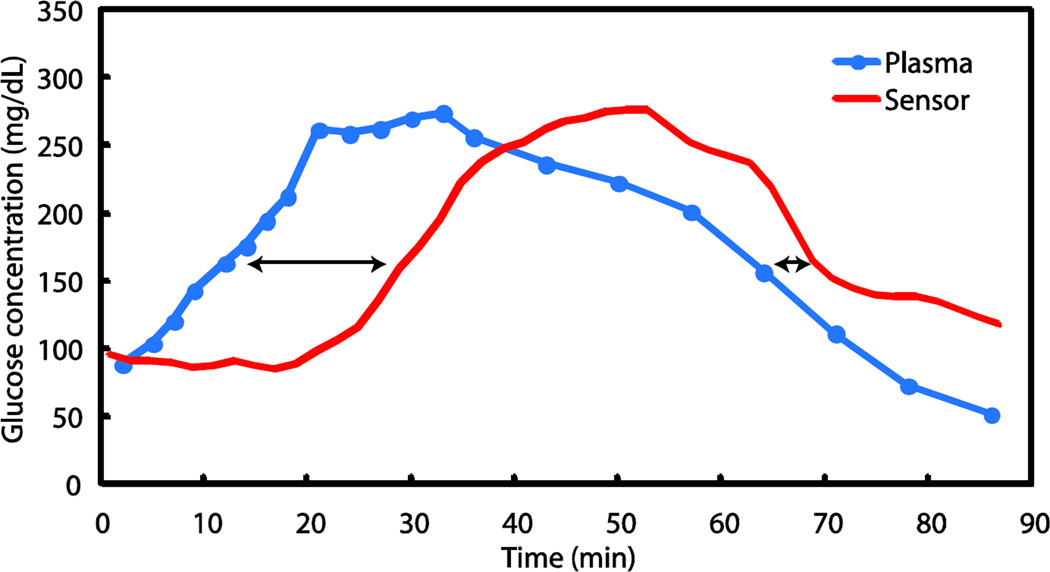
Figure 3. Example of sensor response during an IVGTT excursion.
Plasma glucose values in solid blue circles are connected by the blue line and the sensor signal is the red line. The arrows indicate the delay at the 50% points between the minimum and maximum plasma glucose levels for the rising and falling excursions.

