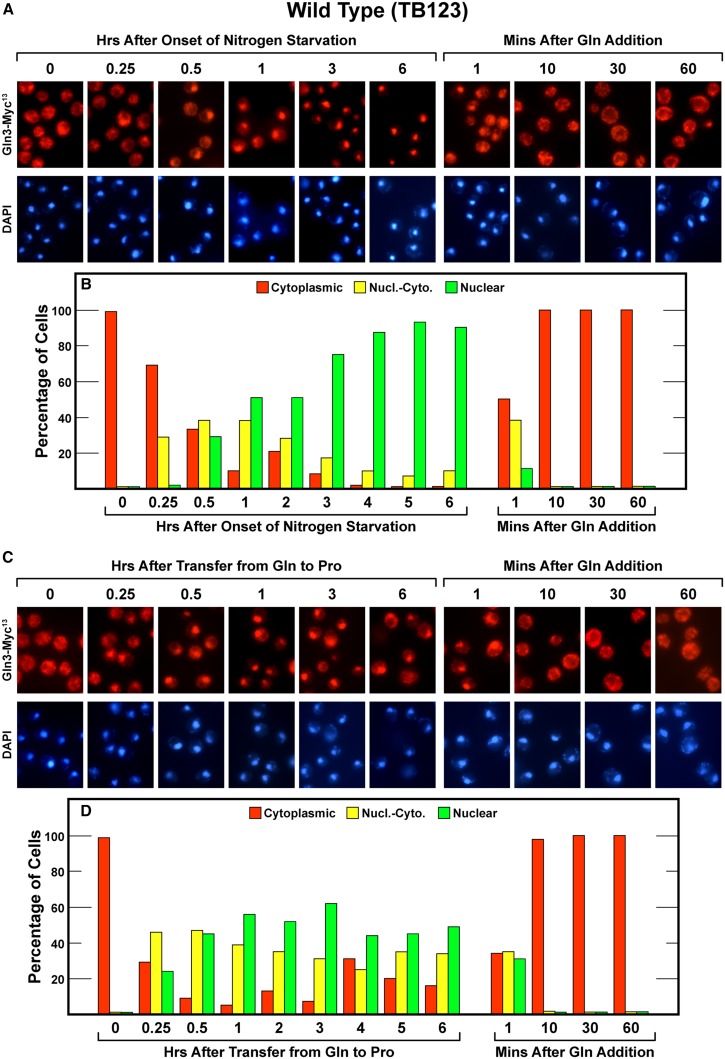
Figure 2.
Time course of Gln3-Myc13 localization in wild-type cells (TB123) after nitrogen starvation (A and B) or transfer from nitrogen-replete to nitrogen-limiting medium (C and D), and resupplying excess nitrogen to all of the cultures (A−D). Cultures were originally grown to mid-log phase (A600 nm = 0.5) in YNB-glutamine medium. At zero time, the first culture was sampled and the remainder transferred to nitrogen-free-YNB medium (A and B) and the second culture was sampled at zero time and the remainder transferred to YNB-proline medium (C and D). Samples of each culture were taken as indicated. After 6 hr of incubation, glutamine was added to each culture (final concentration of 0.1%) and sampling continued for an additional hour. Samples were then processed for indirect immuno-fluorescence microscopy as described in the section Materials and Methods. Time-course experiments as presented here do not easily lend themselves to statistical analysis because even small experiment to experiment shifts in the overall shape of the response curves destroy the precision of the individual measurements. However, we have repeatedly assessed the precision of our scoring; see the section Methods and Materials and Tate et al. (2006, 2010) and Rai et al. (2014).

