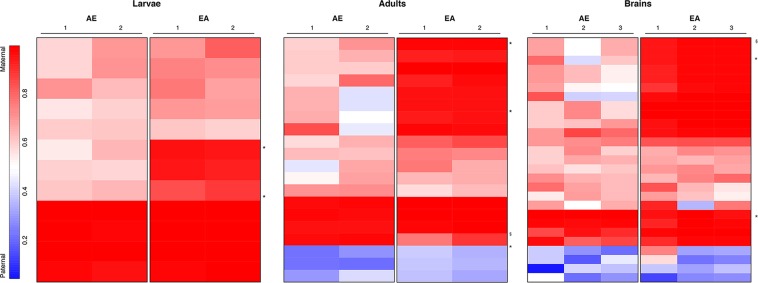
Figure 3.
Parent-of-origin effects on gene expression. A heatmap of the 46 parentally biased transcripts demonstrates that reciprocal crosses have somewhat consistent patterns of parental bias across developmental and behavioral states. Each line represents a cufflinks-predicted transcript with a significant parent-of-origin effect on gene expression. Parental bias for each significant transcript is shown for larvae, adults, and brains. AE: cross between Africanized queen and European-derived drone. EA: the reciprocal cross. Numbers under each cross denote replicates. Blues represent a paternal bias; reds represent maternal biases. *The locus was confirmed with validation datasets. §The locus was tested, but the bias was not confirmed. See Table S1 for detailed results.

