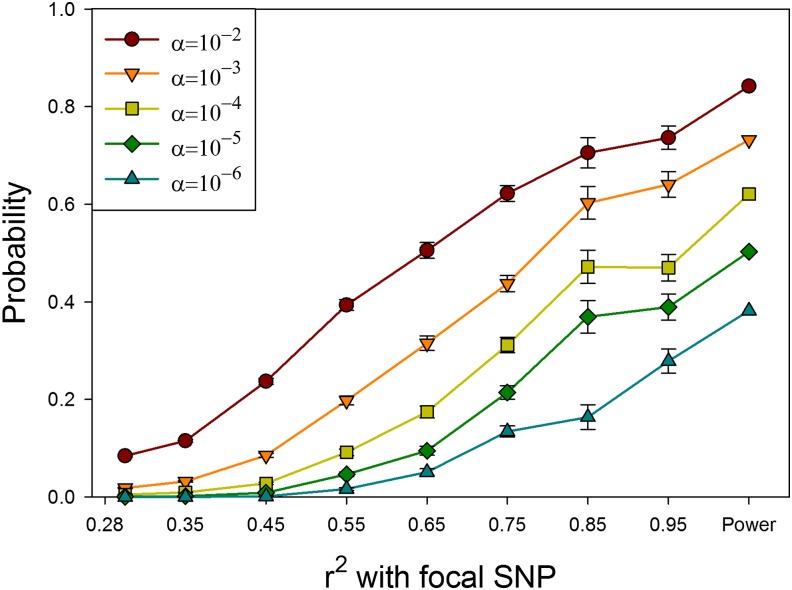
Figure 2.
Probability that a SNP with no phenotypic effect will have a statistically significant association with phenotype as a function of LD with a SNP that does have a phenotypic effect. α= threshold for significance. The focal SNP explains 1% of the phenotypic variance in a multivariate trait. The right-most symbol is power to detect an association with the focal SNP. Values on the X-axis are the midpoints of bins of r2 values.

