Figure 7.
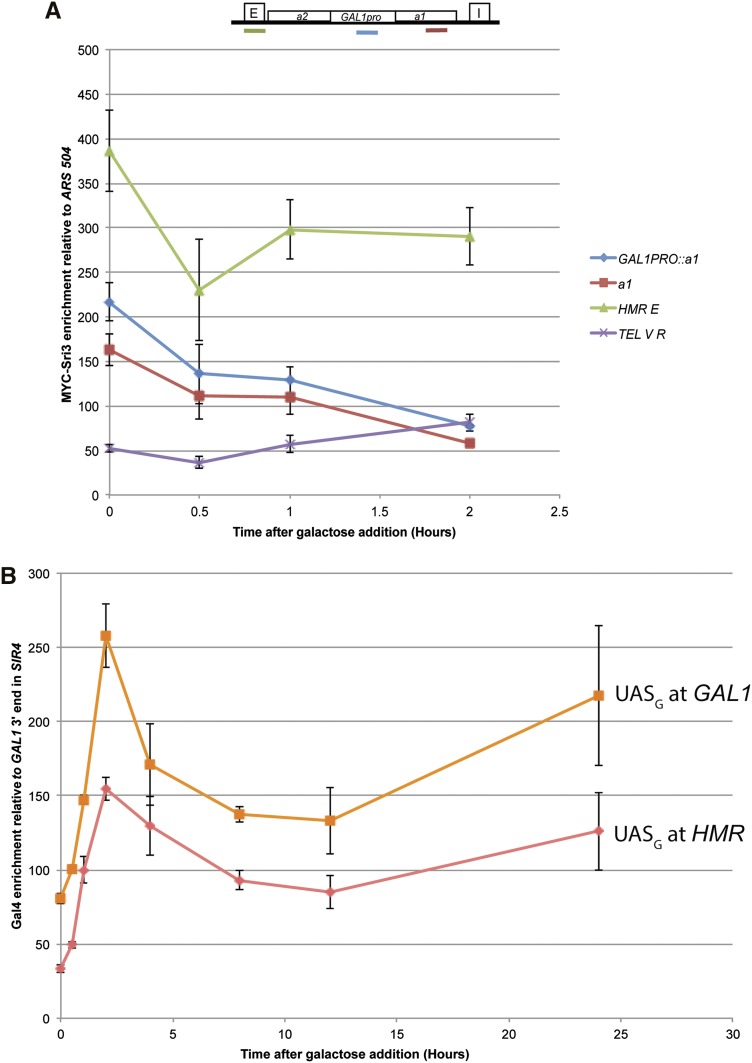
13xMYC-Sir3 and Gal4 enrichment at HMR GAL1pro::a1 upon kinetic galactose induction in SIR4 strains. (A) 13xMYC-Sir3 enrichment as assayed by Sir3 ChIP followed by qRT-PCR at HMR from the identical SIR4 kinetic cultures described in Figure 6. Values are displayed as 13xMYC-Sir3 enrichment relative to an ARS504 negative control primer set. All HMR primer sets showed a statistically significant reduction in Sir3 occupancy between 0 and 2 hr (see text for p-values). The cartoon above the plot shows the location of the primers sets at HMR. Each point represents the average and SEM for three biological replicates. (B) Gal4 enrichment at HMR GAL1pro::a1 and at GAL1 as assayed by ChIP followed by qRT-PCR. Values are displayed as Gal4 enrichment relative to a negative control primer set mapping to the intergenic region 3′ to the GAL1 locus. Each point represents three biological replicates and SEM.

