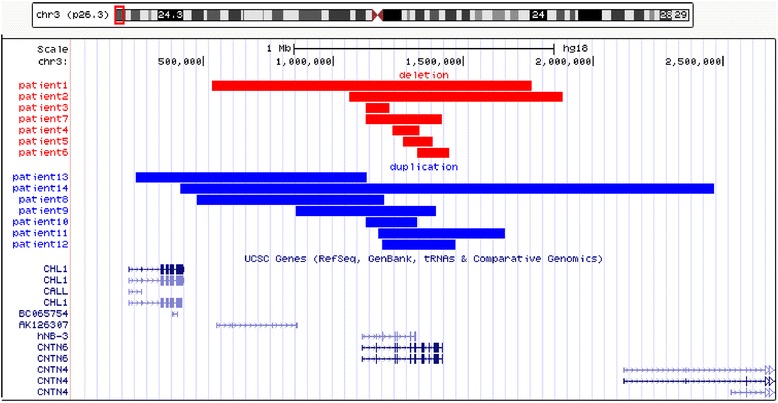
Fig. 2.

Schematic representation of the array-CGH results of the 14 patients with deletion or duplication of the 3p26.3 region. The ideogram of chromosome 3 and the 3p26.3 highlighted in a small red box is shown on top. The red bars represent deletion sizes, and the blue bars represent duplication sizes. The genes in the interval are shown at the bottom
