
Fig. 5.
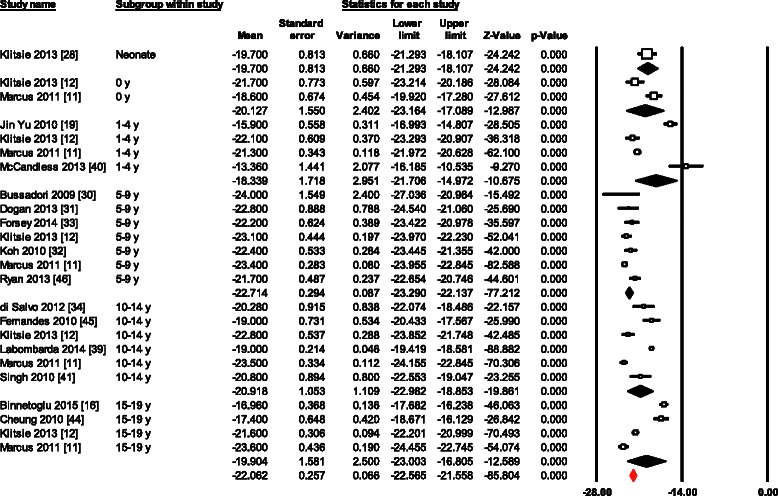
Normal value of CS. The forest plot lists the names of the studies in subgroups. The means and CIs including the results for variance, used in the inverse variance correction are shown
Official websites use .gov
A
.gov website belongs to an official
government organization in the United States.
Secure .gov websites use HTTPS
A lock (
) or https:// means you've safely
connected to the .gov website. Share sensitive
information only on official, secure websites.
Normal value of CS. The forest plot lists the names of the studies in subgroups. The means and CIs including the results for variance, used in the inverse variance correction are shown