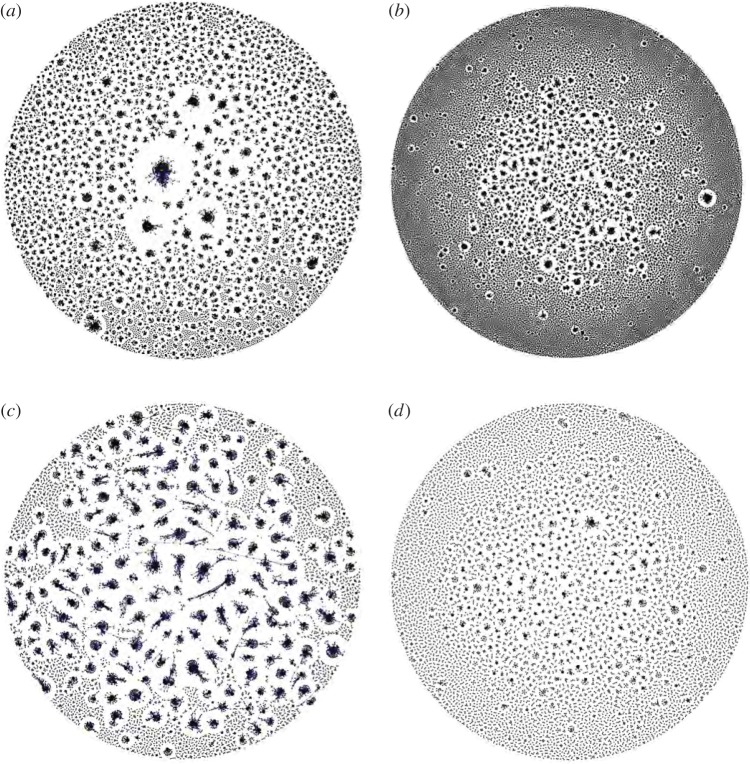
Figure 1.
Network visualization of the diversity of BCR sequences obtained from untreated patient 3 at week 4 (a) and week 108 (b), and from treated patient 4 at week 4 (c) and week 108 (d). Each vertex represents a unique sequence, and the size of each vertex is proportional to the number of reads identical to that sequence. Edges are drawn between vertices that are one nucleotide substitution apart. See §2(f) for further details.

