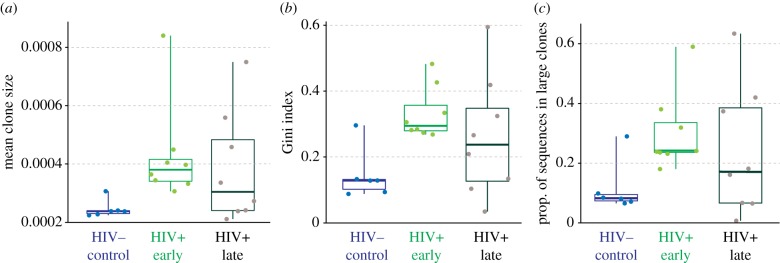
Figure 4.

Comparison of three BCR summary statistics among healthy uninfected individuals (blue) and HIV-infected patients. Values from HIV+ patients are calculated separately for weeks 4–24 (HIV+ early; green) and weeks 52–108 (HIV+ late; black). For each period, statistics were averaged using linear interpolation (see §2f for details). Each box and solid line represents the first, third and second quartiles, respectively, while whiskers indicate range. Data points are superimposed on the box and whisker plots.
