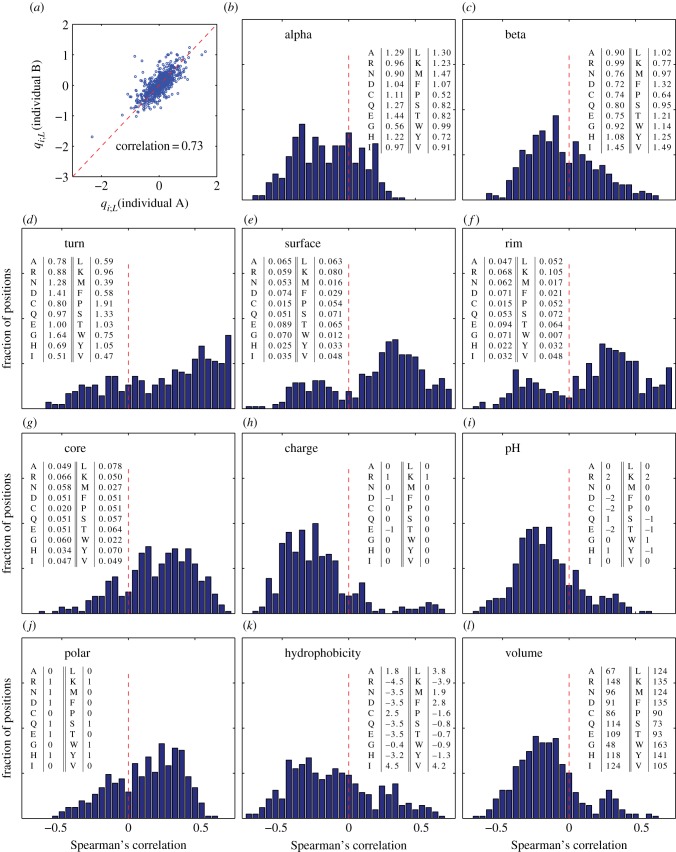
Figure 6.
(a) Scatter plot of the logarithms of the amino acid selection factors qi;L(a) between individuals A and B. The selection factors for the two individuals are strongly, if not perfectly, correlated. This justifies a joint analysis of the properties of those factors, as done in the following panels (b–l), showing correlation of the selection factors with several biochemical properties. Each panel shows the histogram, over all positions and lengths of both individuals, of Spearman's correlation coefficient between the selection factors for a given amino acid and the biochemical properties of that amino acid. The following biochemical properties are considered (from left to right, top to bottom): preference to appear in α-helices (b), β-sheets (c), turns (d) (source for (b–d): electronic supplementary material, table 3.3 [29]). Residues that are exposed to solvent in protein–protein complexes (following definitions and data from [30]) are divided into three groups: surface (interface) residues that have unchanged accessibility area when the interaction partner is present (e), rim (interface) residues that have changed accessibility area, but no atoms with zero accessibility in the complex (f) and core (interface) residues that have changed accessibility area and at least one atom with zero accessibility in the complex (g). Finally, we plot the basic biochemical amino acid properties (http://en.wikipedia.org/wiki/Amino_acid; http://en.wikipedia.org/wiki/Proteinogenic_amino_acid): charge (h), pH (i), polarity (j), hydrophobicity (k) and volume (l). For all properties, the actual numerical values used to calculate the correlations are listed in the inset tables.

