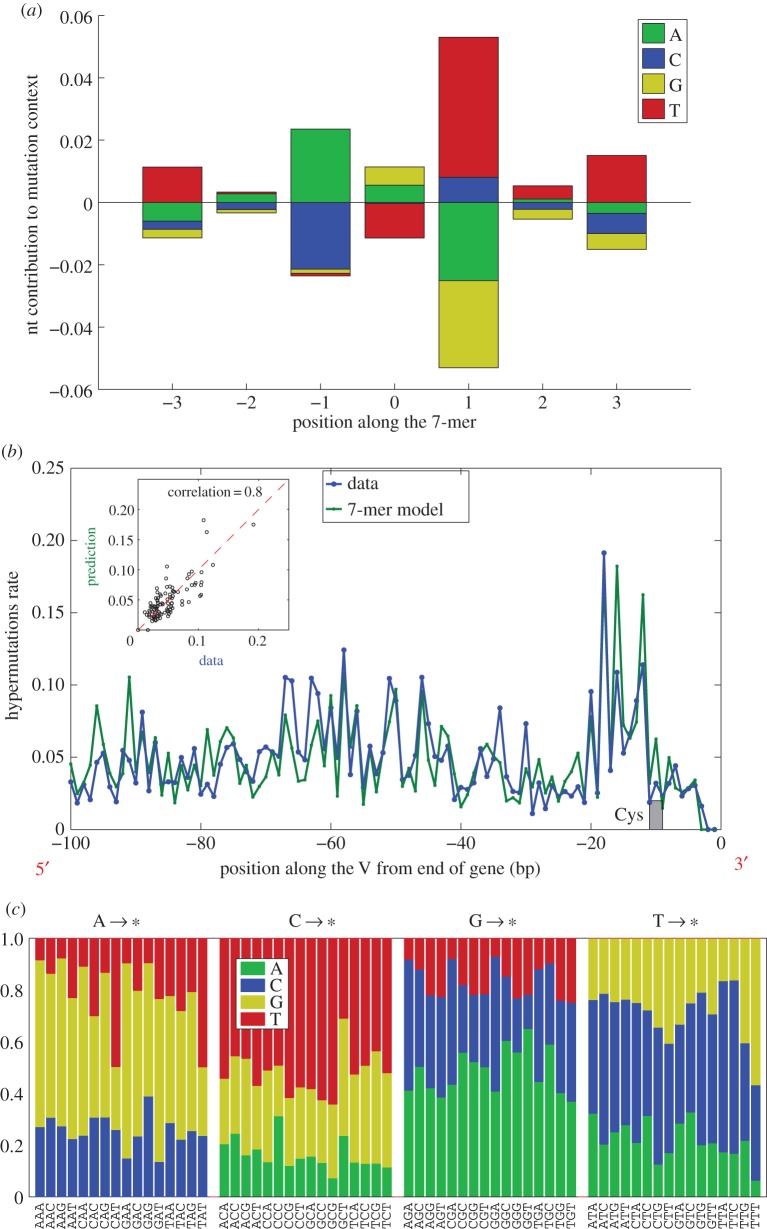
Figure 9.
Sequence dependence of somatic hypermutations. (a) The model mutation probability depends on the central base (position 0) and on the sequence context, three base pairs on each side. The log relative probability of a mutation is the sum of contributions (positive and negative) read off from the sequence motif according to the sequence at each of the seven positions. (b) Comparison of the predictions of this model with the observed hypermutation rate at different positions within the V gene. Mutation ‘hotspots’ are well predicted, and the scatter plot (inset) between data and prediction shows strong correlation. The location of the Cys anchor of the CDR3 is indicated, and we note that the hypermutation rate (in data and model) is low within this special codon. (c) Substitution probabilities to the different bases as stacked columns versus the local trimer context, grouped by the central base. Substitution is not uniform, depending primarily on the base being mutated, but varying with the context.

