
Figure 33.
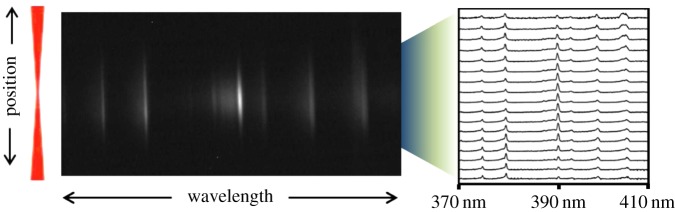
Hyperspectral measurement of the FLEET prompt emission spectrum along the probe laser line showing increased formation of N in the high-intensity region nearest to the focal zone [26]. (Online version in colour.)
Official websites use .gov
A
.gov website belongs to an official
government organization in the United States.
Secure .gov websites use HTTPS
A lock (
) or https:// means you've safely
connected to the .gov website. Share sensitive
information only on official, secure websites.
Hyperspectral measurement of the FLEET prompt emission spectrum along the probe laser line showing increased formation of N in the high-intensity region nearest to the focal zone [26]. (Online version in colour.)