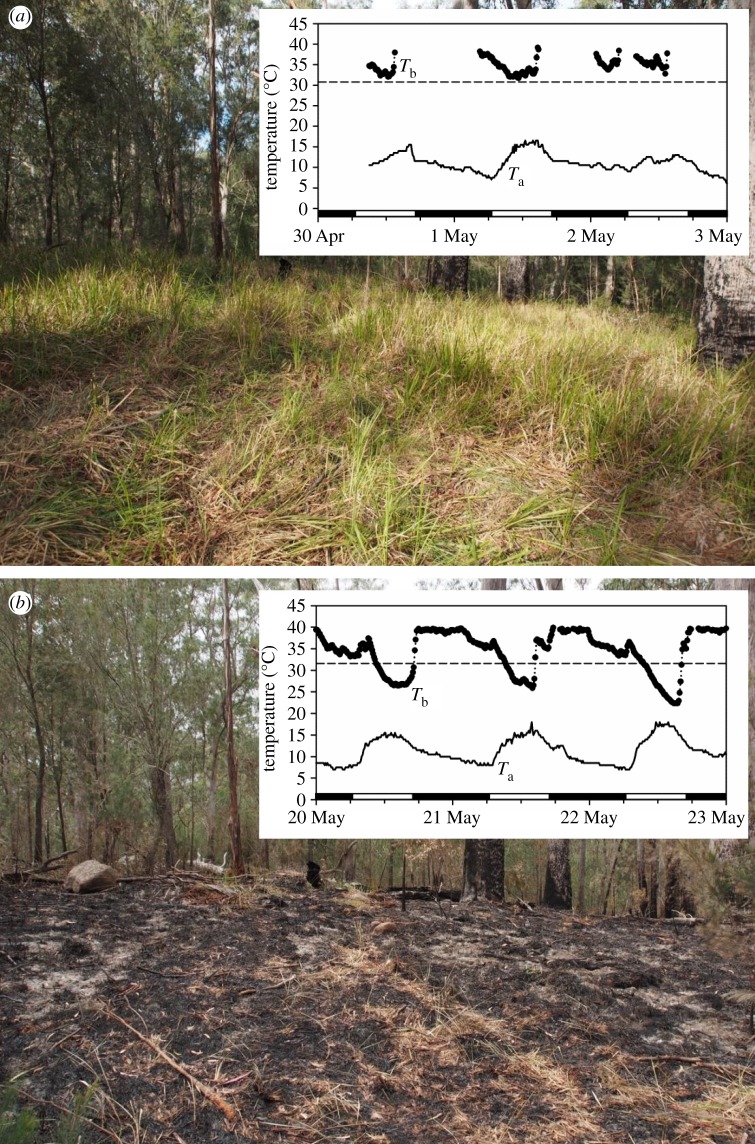
Figure 1.
Photos of the study site and body temperature (dotted line) and ambient temperature (solid line) traces over 3 days: (a) the same area before the fire (pre-burn group) and (b) after the fire (post-burn group). The dashed line represents the torpor threshold. Note the time-series gaps in (a) show nocturnal activity away from the nest; torpor was expressed during the daytime (b).

