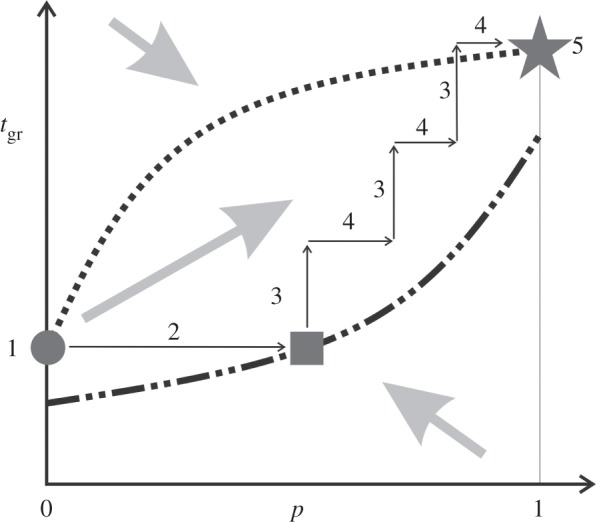
Figure 2.

Fitness landscape and steps during an evolutionary transition in individuality. Selection gradient indicated by thick grey arrows. ∂pr = 0 shown by the dash-dotted line indicates the stable equilibria for a given value of tgr and  shown by the dotted line indicates the stable equilibria for a given value of p. If both parameters are allowed to change, there are two equilibria (grey circle and star), however, only one is stable. In the example, the equilibrium represented by the star is stable, and the circle is unstable, so a group life cycle evolves. The grey box indicates internal equilibrium, possible if tgr is not allowed to change. Numbered steps in an evolutionary transition are described in the text. Figure indicates qualitative results based on the conditions α > β, m(1 − β) < K(1 − α) and tsw is slightly above
  .
.
