Figure 1.

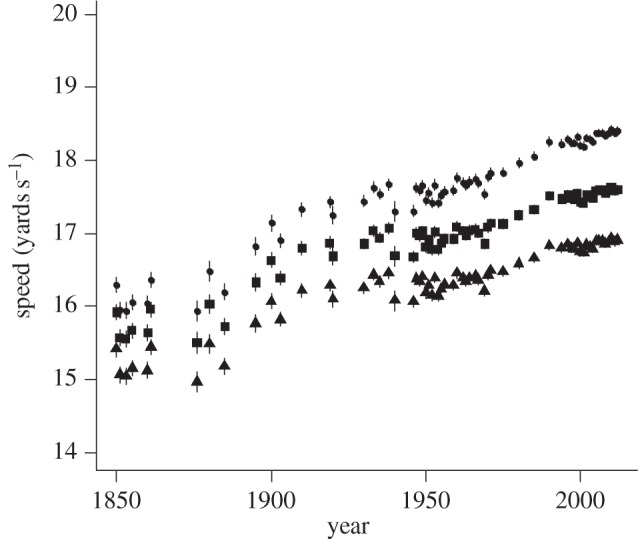
Patterns of temporal change in speeds of elite race winners since 1850. Circles, squares and triangles represent average speed predicted from model 2 at 6, 10 and 17 furlongs, respectively (bars indicate ±1 s.e.).

Patterns of temporal change in speeds of elite race winners since 1850. Circles, squares and triangles represent average speed predicted from model 2 at 6, 10 and 17 furlongs, respectively (bars indicate ±1 s.e.).