
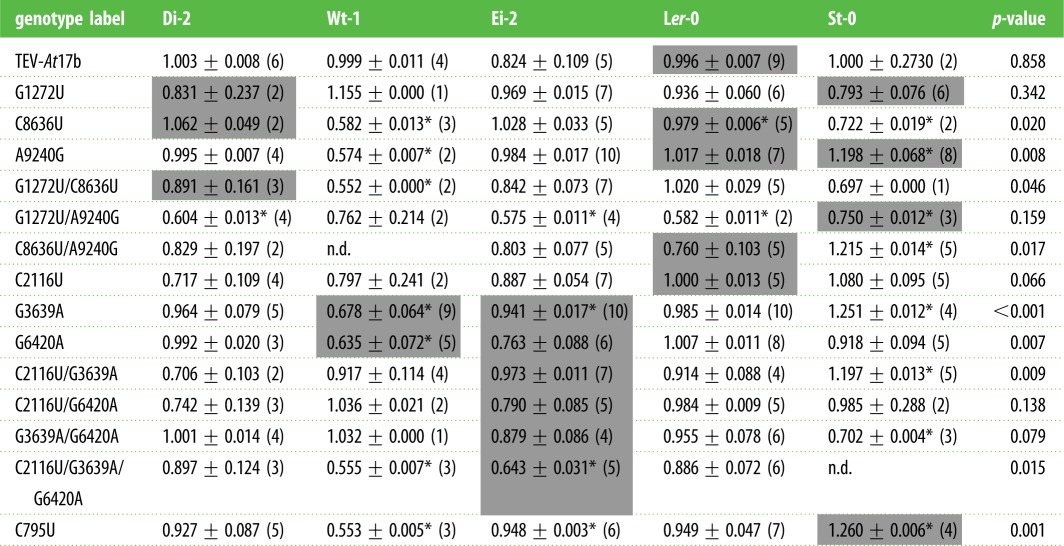
Table 3.
Relative within-host fitness of each viral genotype measured on every A. thaliana ecotype. Values are reported as average ±1 s.e.m. (number of replicates). Asterisks indicate cases significantly different from TEV-At17b (Mann–Whitney test; FDR correction for multiple tests). Shadowed cells indicate the local host in which the mutation was detected. Last column shows the p-value of Kruskal–Wallis tests for differences in relative within-host fitness among ecotypes for each viral genotype.
 |