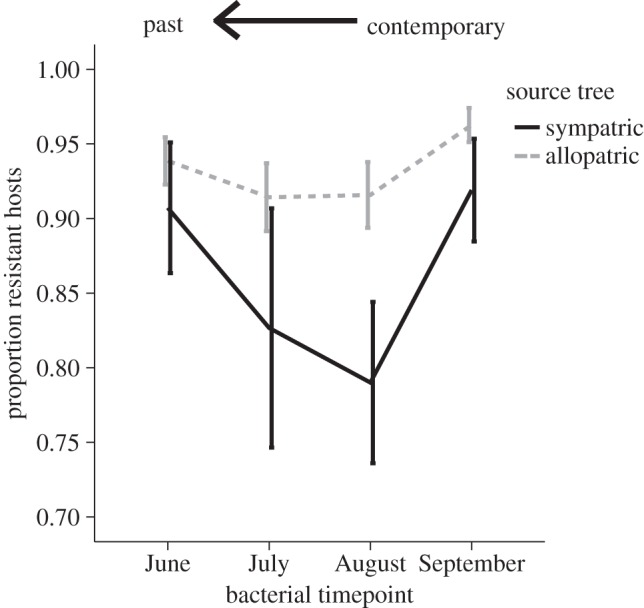
Figure 2.

Evidence for phage local adaptation (and bacterial maladaptation) when tested against bacterial communities from the recent past. Solid black line represents sympatric bacteria from the same tree and dashed grey line represents allopatric bacteria from other trees. This figure is adapted from a previous study in which phage populations from September were cross-inoculated against either sympatric or allopatric bacteria from the contemporary time point (Sep) or each of three previous months [10]. However, in this case, host resistance, rather than phage infectivity as in the original figure, is shown on the Y-axis to allow comparison with the present data.
