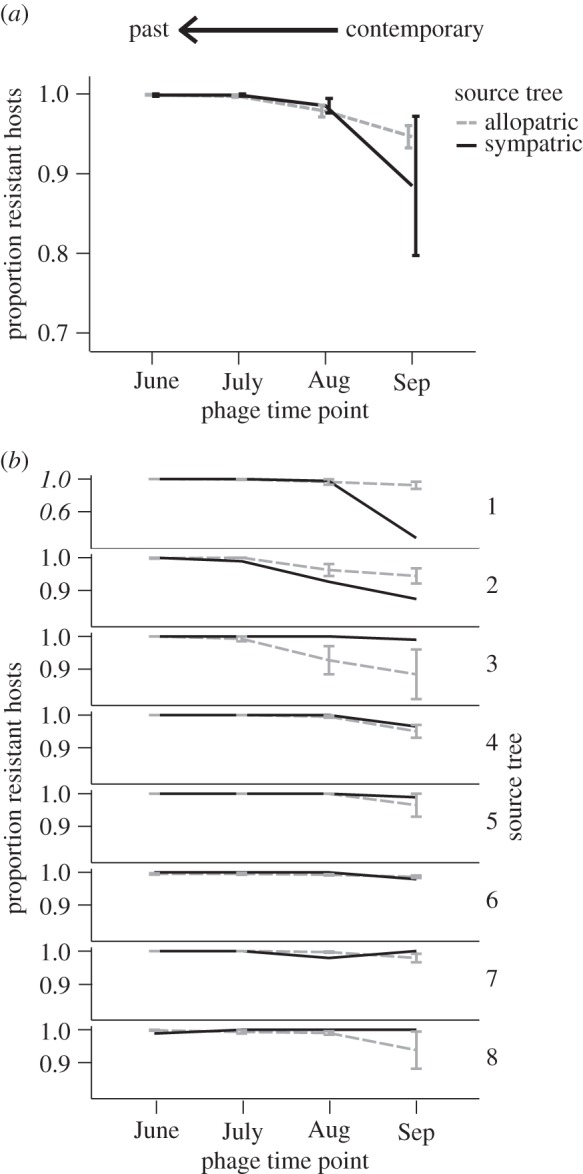
Figure 3.

Comparison of the proportion of bacterial hosts from September that are resistant to sympatric versus allopatric phage populations from either the contemporary time point (Sep), a month earlier (Aug), two months earlier (July) or three months earlier (June). (a) Shows mean resistance across bacterial communities from all eight trees, while (b) shows each bacterial community individually. Note the different scale of the y-axis for tree 1. Error bars represent ±1 s.e.m.
