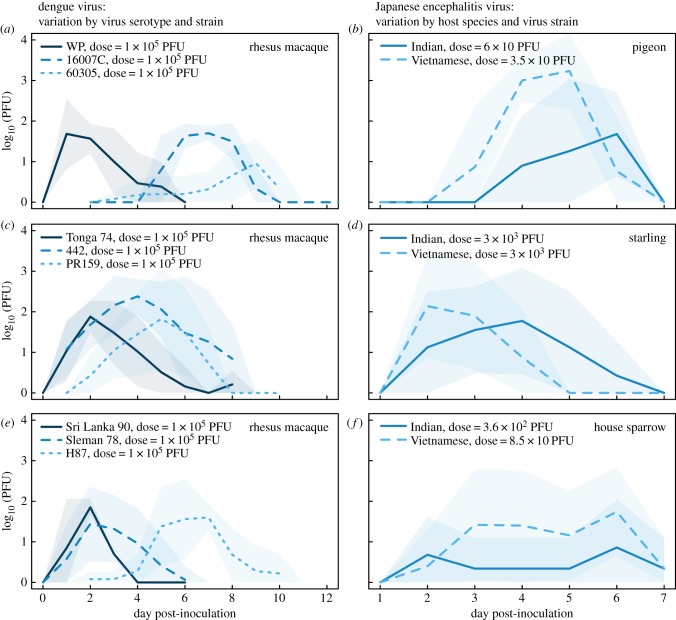
Figure 2.
Variation in viral replication curves across viruses and hosts. Figure shows viral replication (log10 PFU by day) of different strains of dengue 1, 2 and 3 in rhesus macaques ((a), (c) and (e), respectively; data from Althouse et al. [24]), and of two strains of Japanese encephalitis virus (Indian and Vietnamese) in three species of bird ((b,d,f), data from Nemeth et al. [25]). Lines are mean log10 PFU and shaded regions are mean ±1 s.d. Clear differences in the lag to viraemia, magnitude of viraemia and duration of viraemia are evident. (Online version in colour.)

