Figure 3.
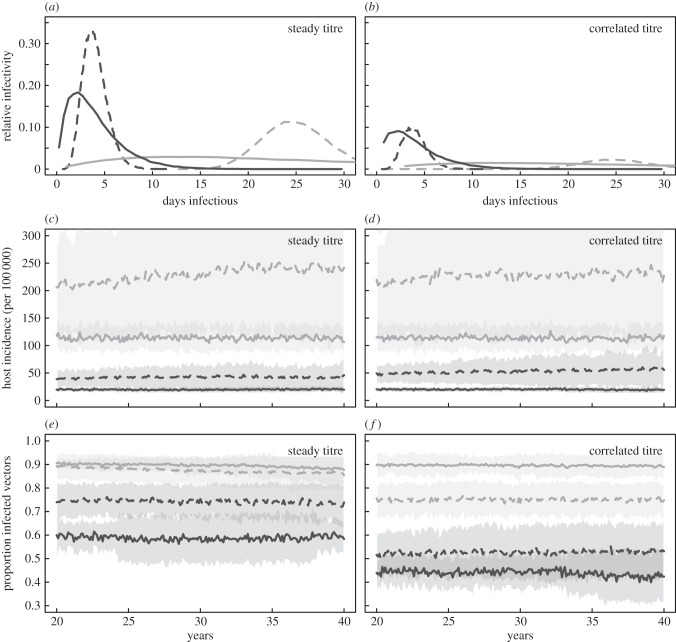
Results of the stochastic arbovirus transmission model. (a) The infectivity curves used in model runs for a steady viraemia titre over the course of infection (constant transmission probability across infection), and (b) the curves for viral titre correlated with peaks in the infectious duration (higher viraemia leading to higher transmission). Lines indicate a mean duration 4 days with variance either 4 days (dark solid curve) or 1.6 days (dark dashed curve), and mean duration 25 days with variance either 25 days (light solid curve) or 12.5 days (light dashed curve). (c,d) Virus incidence in vertebrate hosts for the steady and correlated titre scenarios, respectively, and (e,f) the proportion of infected vectors in each scenario. Colours and line type correspond to distributions in (a,b). Lines are means of 50 stochastic simulations and shaded regions are mean ±1 s.d. Model parameters: transmissibility (probability of infection per infectious bite) = 0.3, amplitude of seasonality = 0.1; 0.5 bites per vertebrate host per day, vector birthrate = 1/7 d−1, vertebrate host birthrate = 1/60 yr−1, initial number of vectors = 15 000, initial number of vertebrate hosts = 10 000.

