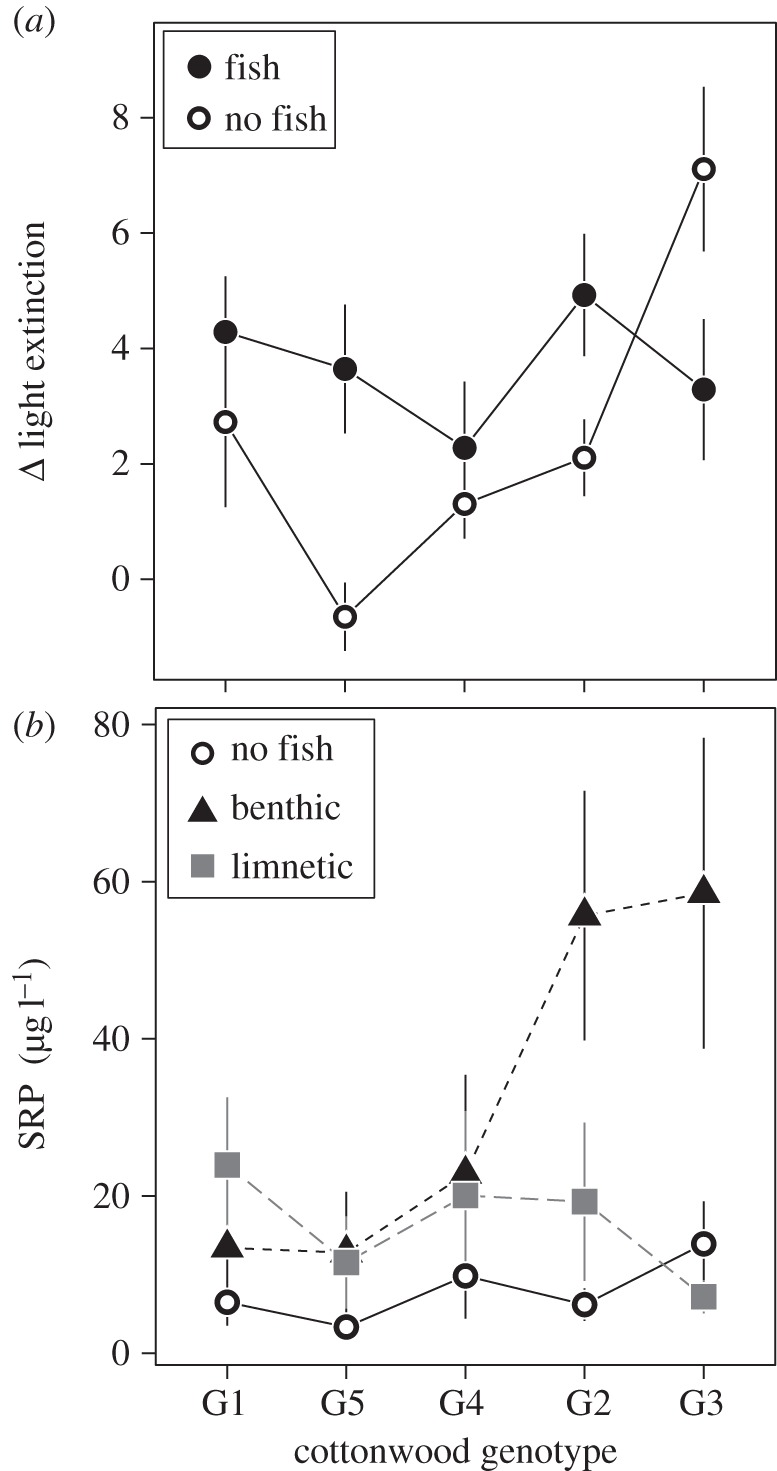
Figure 2.

The effects of black cottonwood genotype (shown in ascending order of productivity (electronic supplementary material, figure S1) and stickleback presence and ecotype on ecosystem responses: (a) light extinction, measured as the number of photons extinguished per centimetre in the water column and (b) soluble reactive phosphorous, a measure of the biologically available phosphorous. Data are shown as means with standard errors. Full ANOVA results for all ecosystem responses are in electronic supplementary material, table S2. Electronic supplementary material, figure S2 illustrates the both SRP and light extinction both before and after the addition of fish.
