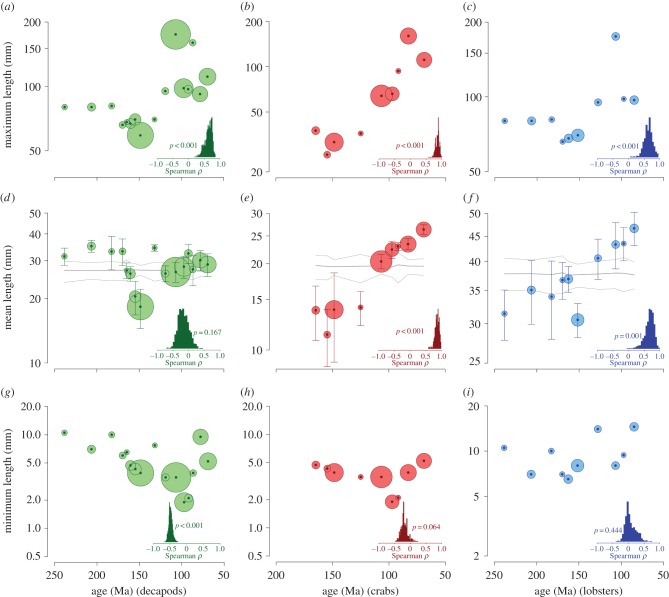
Figure 1.
Maximum (upper row), weighted mean (middle row) and minimum lengths for (a,d,g) decapods, (b,e,h) crabs and (c,f,i) lobsters during the Mesozoic. Confidence bars are ±1 s.e. based on standard deviations of bootstrap-resampled weighted means (1000 iterations per time bin). p-values report significance for the null hypothesis that ρ = 0. Grey lines represent randomization estimates (1000 iteration each) for temporal trends in the weighted mean expected under the null model of body size measurements randomly distributed across means. Thick middle lines represent the mean of the simulation; thin lines represent confidence bands (±1 s.e.). Inset charts (lower right of each panel) depict bootstrap distributions (1000 iterations each) of the Spearman's rank statistic (ρ) for correlation between geological age and weighted mean size. Area of dots represents relative sample size (lowest: 20; highest: 115 for Decapoda, 84 for crabs, 49 for lobsters). Vertical axis with logarithmic scale (base 2). (Online version in colour.)

