
Figure 3.
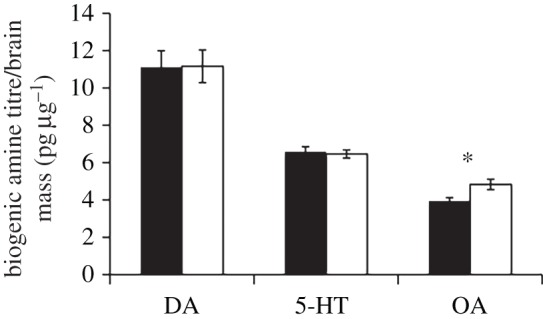
Mean ± 95% CIs (error bars) of dopamine (DA), serotonin (5-HT) and octopamine (OA) brain titres corrected for estimated brain mass are presented for minors (black) and majors (white). Asterisk denotes statistical significance at p < 0.001.
Official websites use .gov
A
.gov website belongs to an official
government organization in the United States.
Secure .gov websites use HTTPS
A lock (
) or https:// means you've safely
connected to the .gov website. Share sensitive
information only on official, secure websites.
Mean ± 95% CIs (error bars) of dopamine (DA), serotonin (5-HT) and octopamine (OA) brain titres corrected for estimated brain mass are presented for minors (black) and majors (white). Asterisk denotes statistical significance at p < 0.001.