
Figure 5.
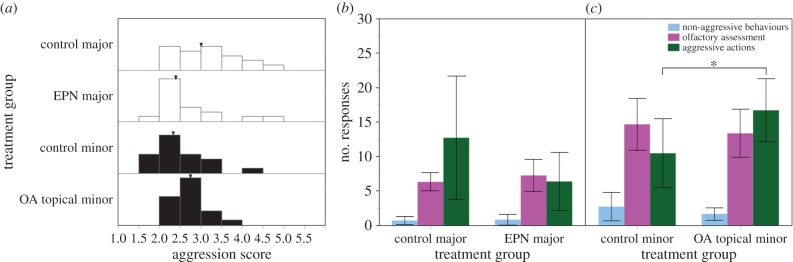
Distribution of aggression scores for control and pharmacologically treated majors (white) and minors (black) are presented with arrowheads indicating mean (a). The mean frequencies of behaviours are shown in control and epinastine (EPN)-treated majors (b) and control and OA topically treated minors (c). Error bars indicate 95% CIs and asterisk denotes statistical significance at p < 0.05. Horizontal bracket indicates statistical significance between behavioural groups. (Online version in colour.)