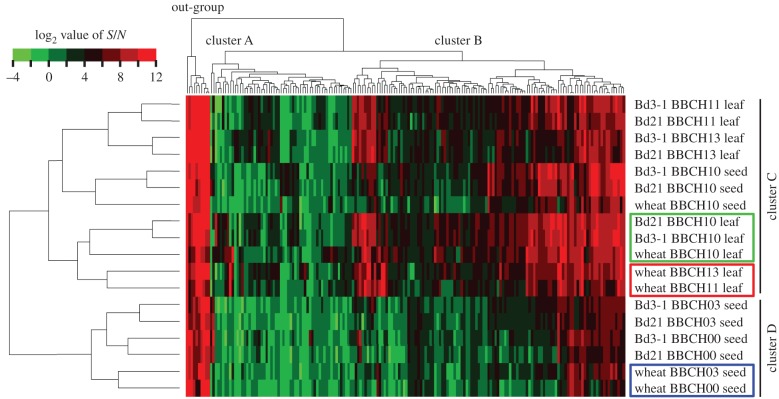
Figure 3.
Metabolite profiling of the seeds and leaves of Bd21, Bd3-1 and Chinese Spring wheat at different growth stages. Dendrogram and heat map show metabolite accumulation, clustered based on the binary logarithm (log2) values of quantitative data, which were obtained by UPLC-TQS. Only the first leaves were used as leaf samples.

