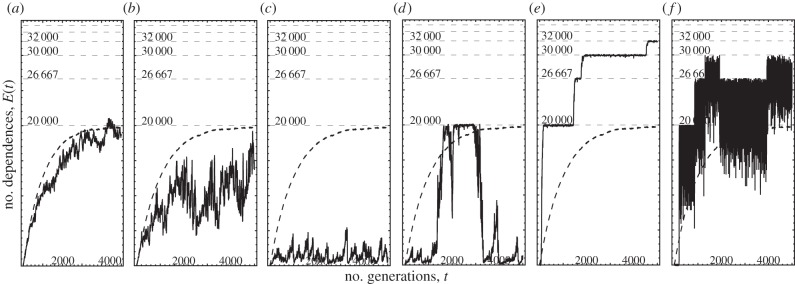
Figure 2.

Regimes of constructive evolution (β > 1). Plotted is the number of edges E(t) as a function of time (generations) t, as the selection strength is increased from left to right r = 2, 4, 9, 10, 15, 100 while mutation probability is kept constant N2p = 20. The dashed straight lines indicate the stable number of edges corresponding to an integer number k of equal-sized ‘bunches’, E = N2(1 − 1/k). The dashed curved line is the outcome of the fully neutral simulation (r = 0). For all panels, N = 200, β = 1.01.
