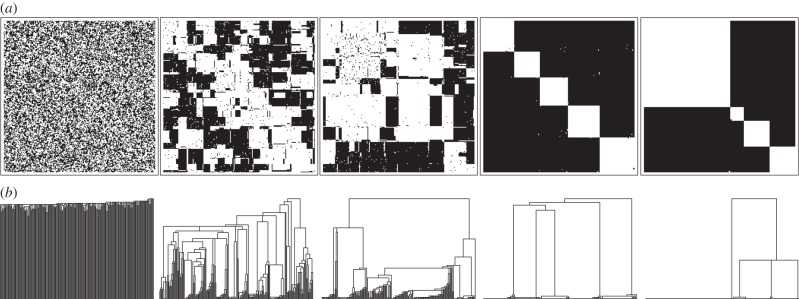
Figure 3.

Interdependence and genetic composition. Connectivity matrices (a) and their respective phylogenetic trees (b) show the dramatic difference in the final organization of the population caused by varying selective strength (left to right, r = 0,2,4,15,100) in the constructive regime (β > 1). The connectivity matrix element Cij is marked by black if individual i provides fitness to j, and left white if there is no exchange. The tree linkages in the bottom are formed according to smallest intercluster dissimilarity, defined by the L1 norm. For all panels N = 200, N2p = 20, β = 1.01 is kept constant. We see the onset of ‘bunch’ (anti-community) formation even in the weak selection limit (compare first two panels). The number and definition of bunches increases with higher selection strength (fourth panel). In the strong selection limit bunches compete with each other, leading to size heterogeneity (fifth panel).
