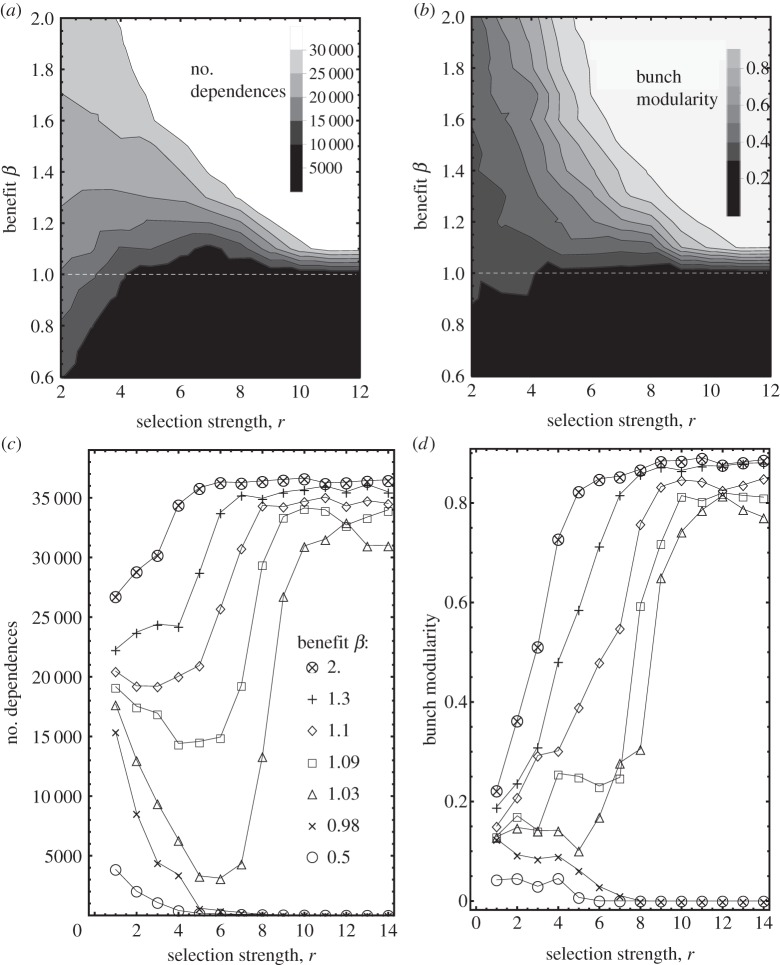
Figure 4.
Phases of interdependence. The phase diagrams (a,b) displays the asymptotic dependence number E (a) or the bunch modularity (b) as a function of relevant system parameters. Traversing both phase diagrams (c,d) in the horizontal direction clarifies the phase profile. Since some of the phases are highly dynamic, the E (a) is taken to be the minimum number of dependences in a large time-window in the long-time limit.

