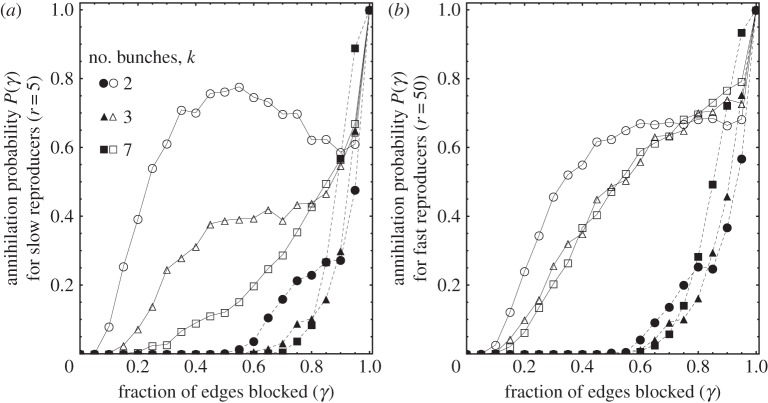
Figure 5.
Manipulation and control of social evolution. Of the entire population (N = 200), we mark η = 2% (empty markers) and η = 98% (filled markers) of the nodes as susceptible to our perturbation. We then block γ (horizontal axis) of the out edges of the susceptible population, and determine the probability that the strong cooperating population collapses into a weak non-cooperating one (i.e. to E = 0). To clearly distinguish between the spread of the resistant subpopulation η, and novel mutations that occur after our perturbation, we set p = 0 (finite p merely adds noise to the curves). We observe that the effect of the drug strongly depends on the community structure for slow reproducing species (a, r = 15) but not for fast reproducing ones (b, r = 60). The dashed curve shows how devastating even a small number of anti-social individuals are for the whole population and suggests treatments where individual cells are targeted. The strong dependence of annihilation probability on k for small k (a) might explain why quorum blockers are effective against some biofilms forming bacteria but not others. Interestingly, for k = 2, P(γ = 0.5) is significantly higher than P(γ = 0.95), suggesting that for small number of cooperative bunches smaller perturbations may be more effective than larger ones.

