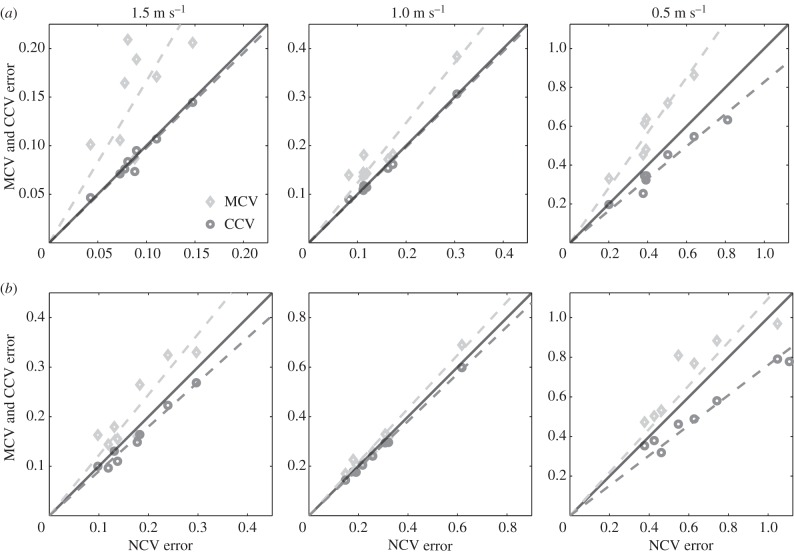
Figure 5.
Walking is asymmetric, but neglecting this by training a model on the combined data can nevertheless improve fitting. (a) Step-to-step maps. At all speeds, the mean MCV errors (light grey diamonds) were significantly worse than the mean NCV errors, indicating that steps were indeed asymmetric. Despite this left–right asymmetry, the mean CCV errors were not significantly different from the mean NCV errors at the two fastest walking speeds tested and, more surprisingly, were actually lower at the slowest walking speed. The slopes of the fitted lines (dashed) determine the relative increase (m > 1) or decrease (m < 1) in CV error relative to the NCV error. (b) Stride-to-stride maps. By the same statistical measure, strides were also asymmetric at all speeds, but less substantially so. Moreover, the mean CCV error was lower than mean NCV error at all speeds.

