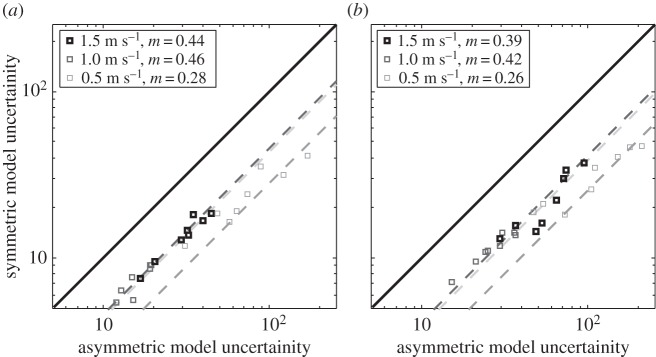
Figure 6.

Model uncertainty at all three speeds was lower when symmetry was assumed in both (a) step-to-step and (b) stride-to-stride maps. Each marker compares the model uncertainty with asymmetry and with symmetry of a single individual. Dashed line denotes the best fitted line (passing through the origin) to the comparison markers. The percentage improvement is given by (1 − m) × 100, where m is the slope of the fitted line.
