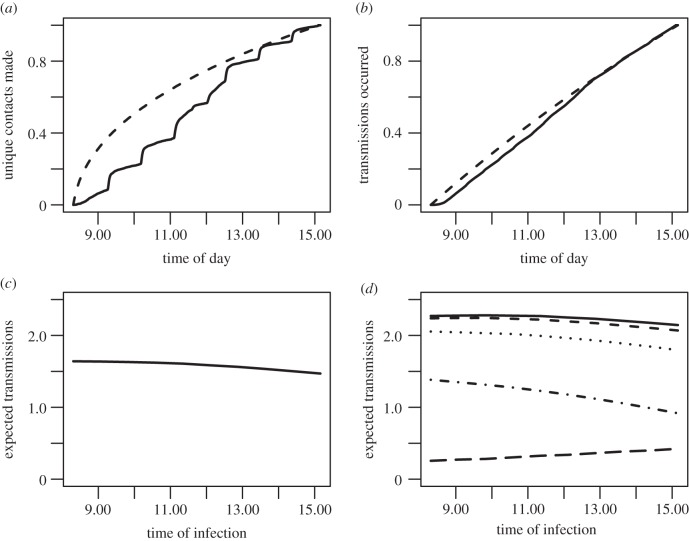
Figure 3.
Comparison of transmission results on the dynamic and static networks. (a) The proportion of unique contacts made by time of day in the dynamic contact data (solid) compared with those expected under the static network assumption (dashed). The solid curve clearly exhibits the effects of the class-switching schedule of the school, while the dashed curve shows that more unique contacts would be made earlier in the day if the same number of interactions were distributed randomly. (b) From the transmission simulations, the cumulative proportion of all transmissions that occurred by the given time of the school day in the dynamic alternating (solid) and static alternating (dashed) versions. The static assumptions cause transmission times to shift earlier in the day. (c) The expected number of transmissions from an individual who was infected at a given time of the school day, averaged over the five school days Monday–Friday. Results are from the Mid1, static averaged network, higher-transmissibility scenario. (d) Expected transmissions by time of day for each day Monday–Friday (top to bottom): solid, Monday; short dash, Tuesday; dot, Wednesday; dash-dot, Thursday; long dash, Friday. Individuals infected Monday–Thursday morning will be more infectious themselves during school the following day than those infected in the afternoon, because the peak of infectiousness is not typically reached until more than a day after exposure. By contrast, individuals infected on Friday will usually be past peak infectiousness when returning to school 3 days later on Monday, so those infected more recently (i.e. Friday afternoon) will produce more transmissions on average. The overall downward daily trend in expected transmission occurs because the weekend occurs during a greater area of the infectiousness curve the later in the week one is infected.

