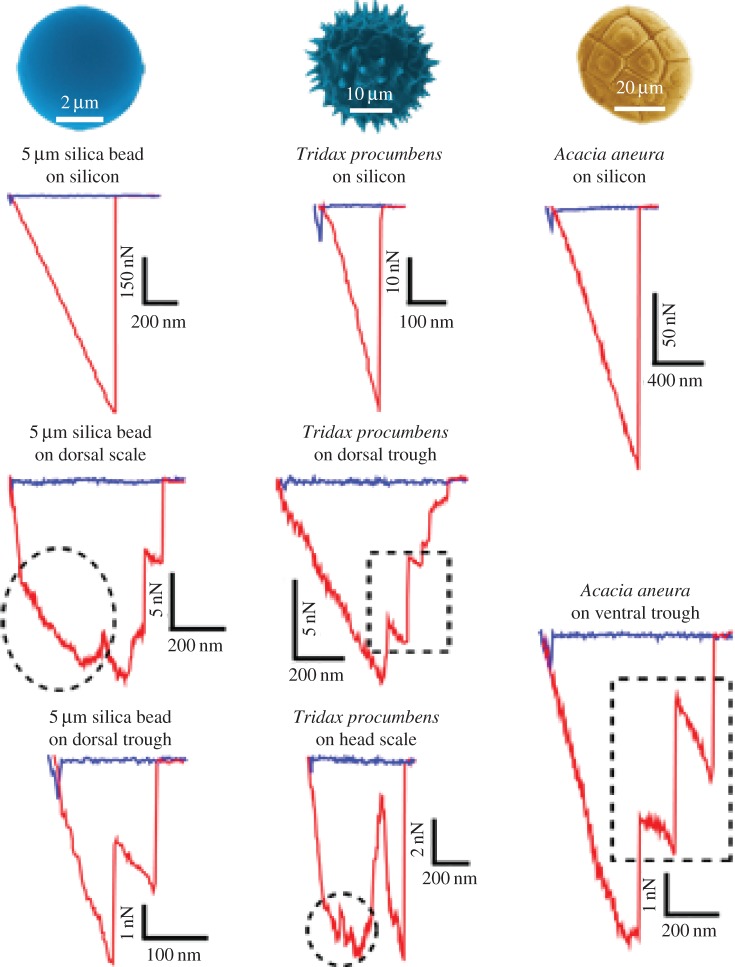
Figure 8.
Examples of force versus distance curves demonstrating fine structure of the adhesional contacts. The approach part of the cycle is shown in blue (with some distinct snap-on features where the surfaces make contact), while the retract part is shown in red. The retraction shows a number of features such as possible multiple releases from the surface (e.g. dashed square boxes) and the change in gradients of the force–distance extension/retraction region of the curves (e.g. circular dashed sections). The reduced gradients may indicate a variety of interactions as discussed in §3.2. (Online version in colour.)

