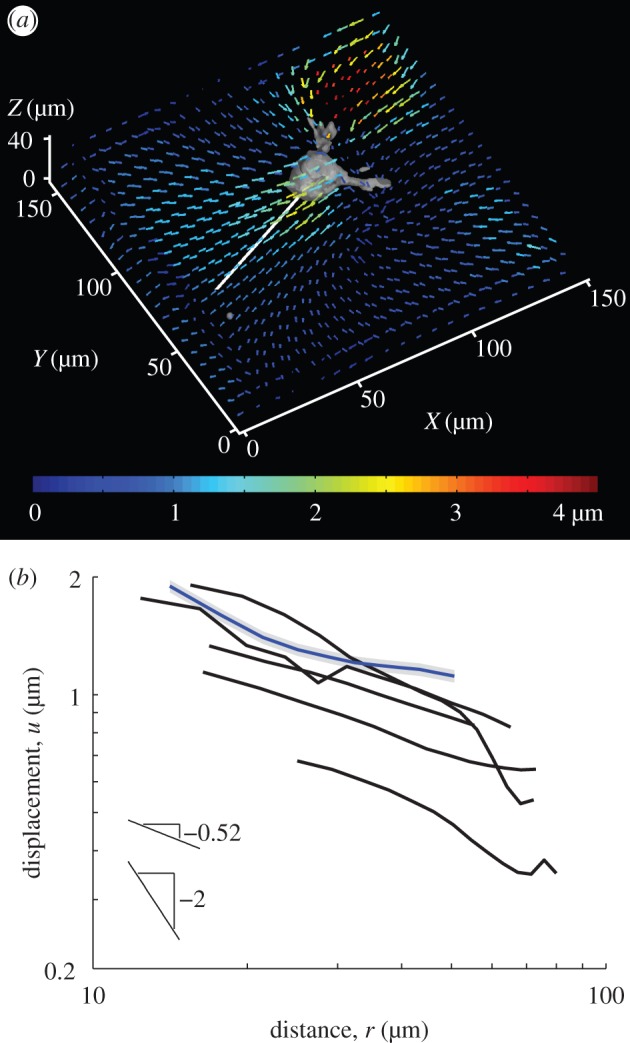
Figure 1.

Experimentally measured displacements induced by isolated cells embedded within a three-dimensional fibrous matrix. (a) The coloured quivers plot three-dimensional matrix displacement vectors applied by a cell to a three-dimensional fibrin matrix. Paths (white) are chosen proceeding outward from the cell body. (b) Displacement magnitudes along the paths are averaged for multiple time points and plotted. Each curve is for a different cell. The blue curve shows displacements for the cell in (a). The grey shading behind the blue curve shows typical error of the displacement measurement after averaging. Data used to generate these curves is in the electronic supplementary material.
