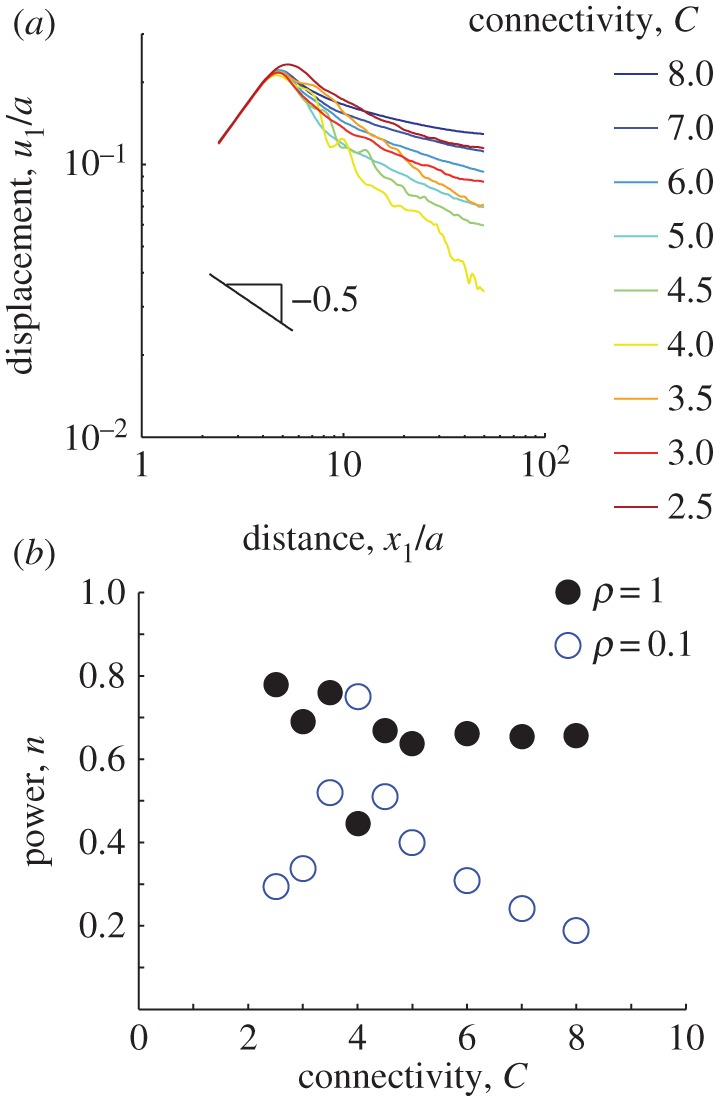
Figure 4.

Simulated displacements due to an elongated cell. An ellipse with a ratio of semi-major to semi-minor axes a1/a2 = 4 is simulated contracting along its long axis in a circular region of radius b = 50a where  . (a) Displacements along the major axis u1 are plotted against distance along the axis from the centre of the ellipse x1 for connectivities ranging from C = 2.5 to C = 8. As in figure 3, fluctuations are observed for connectivites near the critical value C = 4. (b) Displacements far from the cell (i.e. for x1/a > 5) are fit to
  . Solid black circles represent decay powers n for fibres that do not buckle (ρ = 1); open blue circles represent n for fibres that do buckle (ρ = 0.1). For simulations with buckling, except near the critical connectivity C = 4, decay powers are smaller than the linear elastic solution n = 1 and smaller than simulations without buckling.
