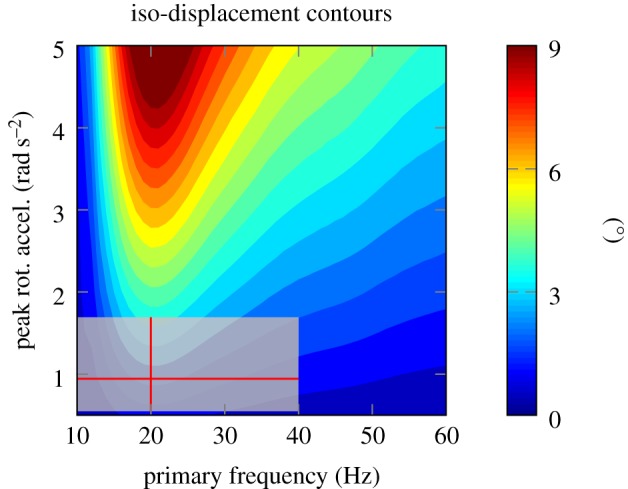
Figure 7.

Implications of the results: contour plots of constant relative motion of brain as a function of skull's rotational acceleration amplitude and frequency based on simulated skull motion (sinc function with parameter sweep in frequency and amplitude). As we move towards lower frequencies on the left, relative brain motion shows more sensitivity to changes in frequency than peak rotational acceleration. The interquartile range of football head impacts is also shown as box plot in two dimensions for comparison.
