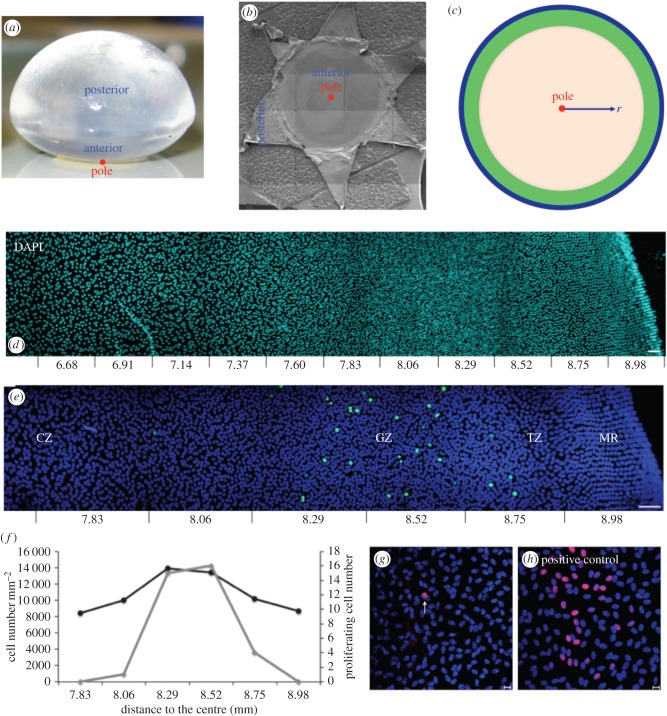
Figure 1.
Relationship of lens morphology to its epithelium and the schematic of the mathematical model. Biological images showing cell-density variation. (a) Bovine lens showing its anterior and posterior surfaces and the location of the anterior pole (red circle). (b) Dissected and flat-mounted lens capsule. The anterior pole (red circle) is indicated. (c) Schematic of the mathematical model indicating the pole (red circle) and, for orientation purposes, the different zones; CZ (beige); GZ (green) and TZ/MR (blue). The origin of radial distance r from the anterior pole is indicated. (d) A montage of images taken from a flat-mounted bovine lens epithelium stained with DAPI to identify cell nuclei. The montage illustrates the cell-density changes in the lens periphery (equator). Distance (mm) from the anterior pole is indicated. Scale bar, 50 μm. (e) Flat-mounted bovine lens epithelium stained with the cell proliferation marker Ki-67 (green channel) and DAPI (blue channel). The zone with the most Ki-67 labelling is defined in the literature as the GZ, which is in the lens periphery. The MR is the most peripheral feature of the lens epithelium. The TZ is between the MR and GZ. Distance (mm) from the anterior pole is indicated. Scale bar, 50 μm. (f) Cell density (black line) and Ki-67 labelling (grey line) from (c) were counted confirming that most Ki-67 labelling coincided with the highest cell density in the lens epithelium. (g) TUNEL staining of the bovine lens epithelium (red channel) and counter-stained with DAPI (blue channel). TUNEL-positive cells are rarely observed. One example of a TUNEL-positive cell is shown (white arrow). Scale bar, 10 μm. (h) A flat-mounted epithelium was exposed to Benzonase Nuclease (100 U ml−1) as a positive control to introduce more DNA strand breaks prior to TUNEL staining. Scale bar, 10 μm.

