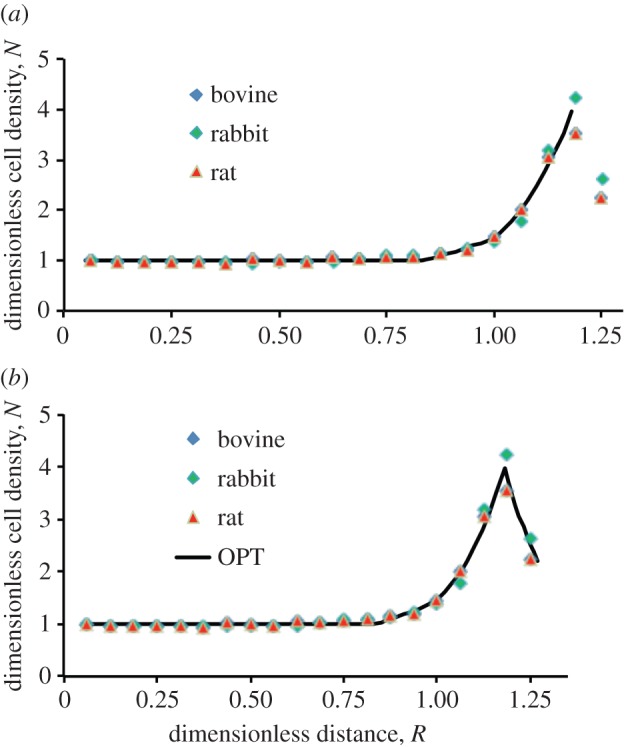
Figure 5.

Comparison of the ordered pull-through model with the experimentally measured data. (a) Comparison of the model for lens epithelium (solid line) with the experimentally measured data (symbols). (b) Comparison of the ordered pull-through model for lens epithelium with experimental data obtained for flat-mounted bovine, rabbit and rat lenses.
